python-plotly
1 import pandas as pd
2 import plotly.express as px
3 import plotly.graph_objects as go
4 import plotly.offline as py
5 py.init_notebook_mode(connected=True)
6 df = px.data.iris()
7 print(df.head())
8 print(df.describe())
   sepal_length  sepal_width  petal_length  petal_width species  species_id
0           5.1          3.5           1.4          0.2  setosa           1
1           4.9          3.0           1.4          0.2  setosa           1
2           4.7          3.2           1.3          0.2  setosa           1
3           4.6          3.1           1.5          0.2  setosa           1
4           5.0          3.6           1.4          0.2  setosa           1
       sepal_length  sepal_width  petal_length  petal_width  species_id
count    150.000000   150.000000    150.000000   150.000000  150.000000
mean       5.843333     3.054000      3.758667     1.198667    2.000000
std        0.828066     0.433594      1.764420     0.763161    0.819232
min        4.300000     2.000000      1.000000     0.100000    1.000000
25%        5.100000     2.800000      1.600000     0.300000    1.000000
50%        5.800000     3.000000      4.350000     1.300000    2.000000
75%        6.400000     3.300000      5.100000     1.800000    3.000000
max        7.900000     4.400000      6.900000     2.500000    3.000000
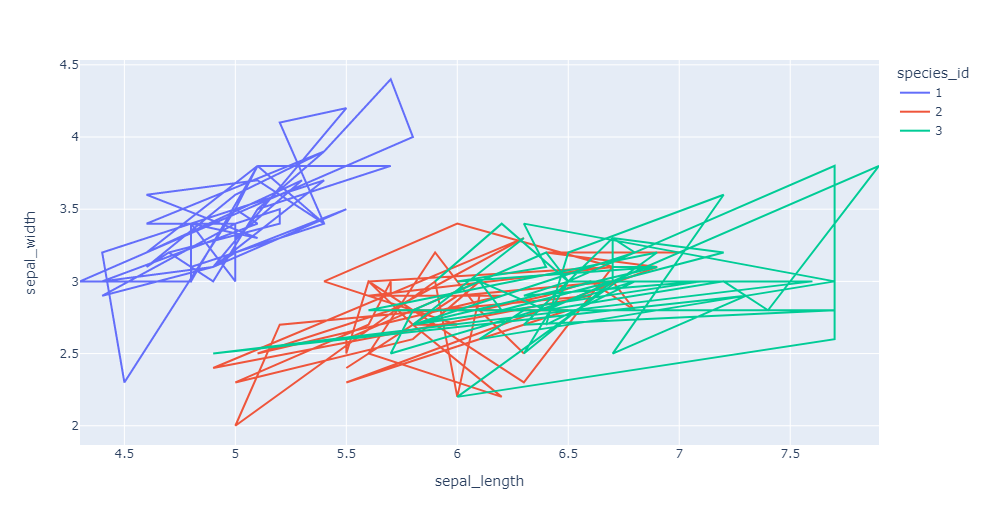
px.line(df,color=df.species_id,x='sepal_length',y='sepal_width').show()#color根据label
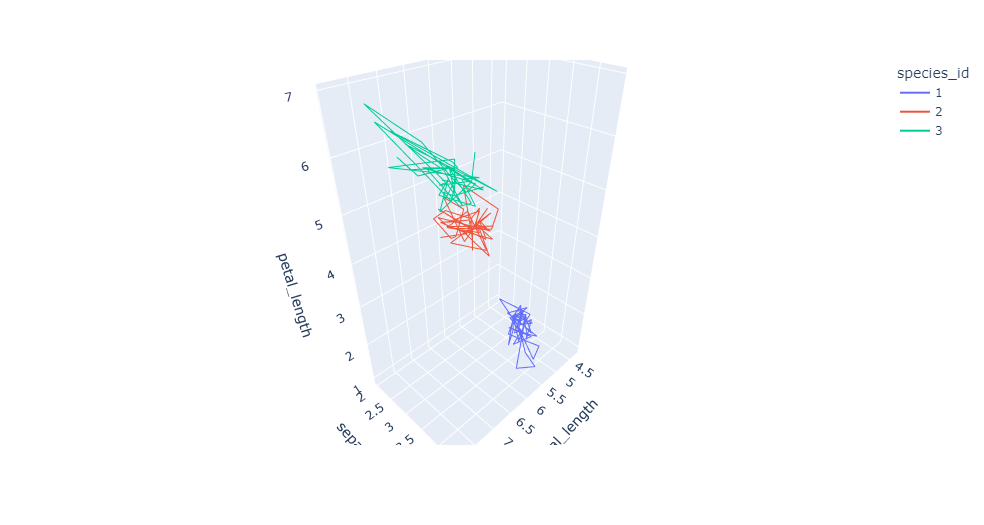
px.line_3d(df,color=df.species_id,x='sepal_length',y='sepal_width',z='petal_length').show() #color根据label
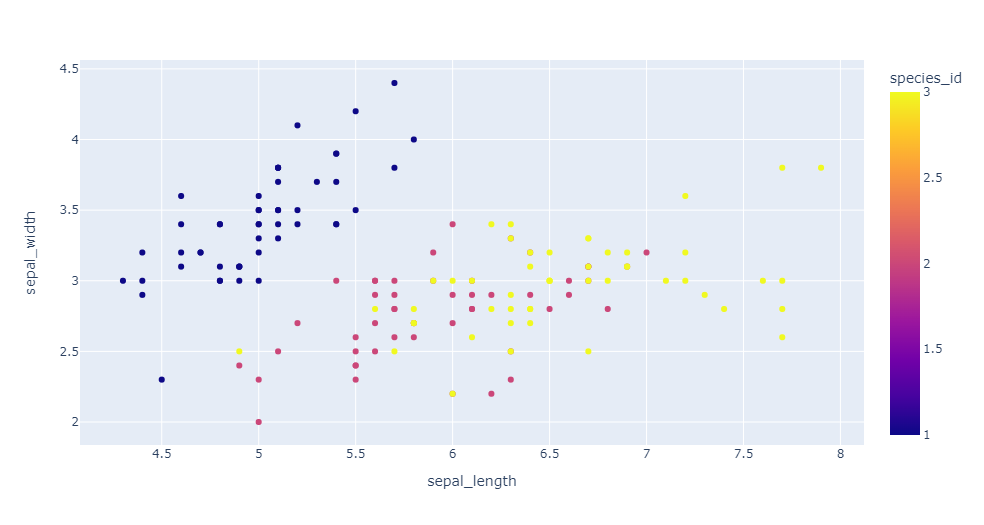
1 px.scatter(df,color=df.species_id,x='sepal_length',y='sepal_width').show()#color根据label
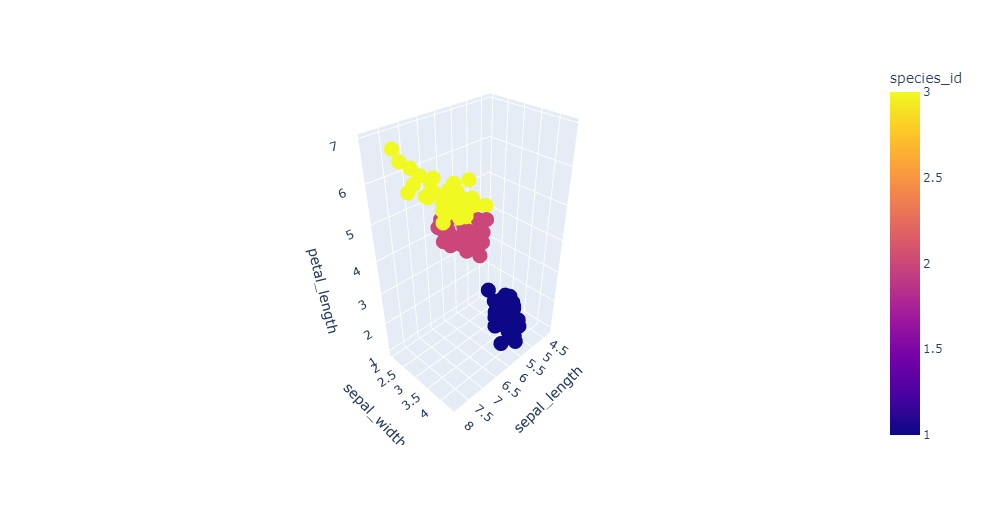
px.scatter_3d(df,color=df.species_id,x='sepal_length',y='sepal_width',z='petal_length').show() #color根据label
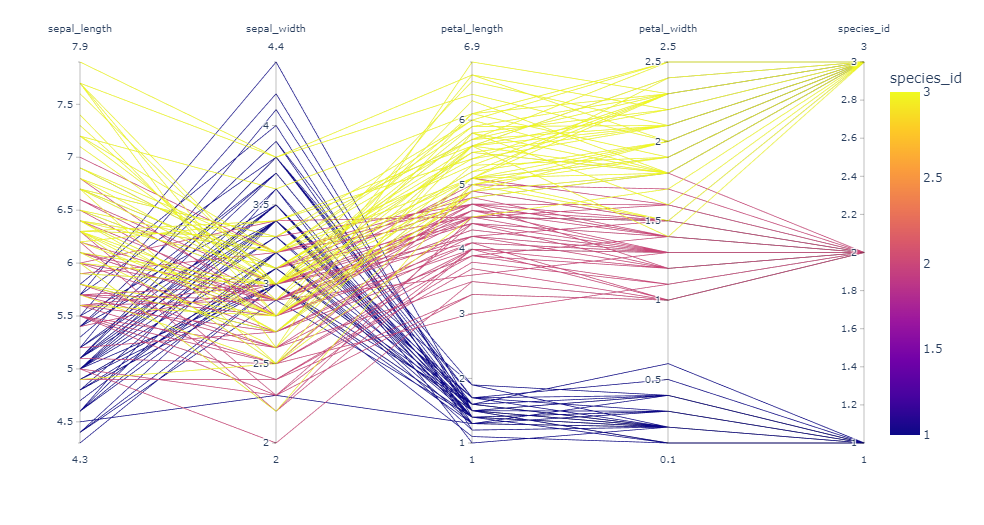
1 fig=px.parallel_coordinates(df,color=df.species_id) #color 2 fig.show()
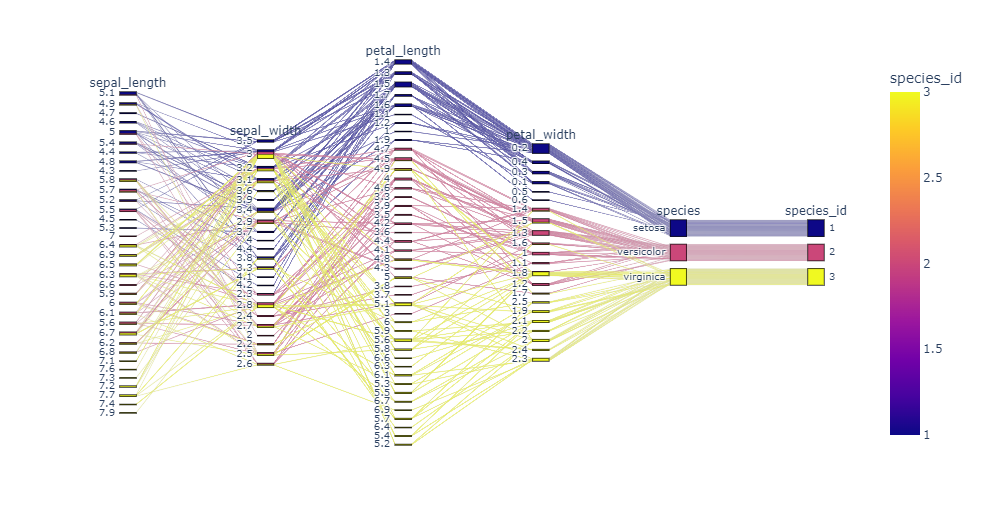
1 px.parallel_categories(df, color=df.species_id).show()
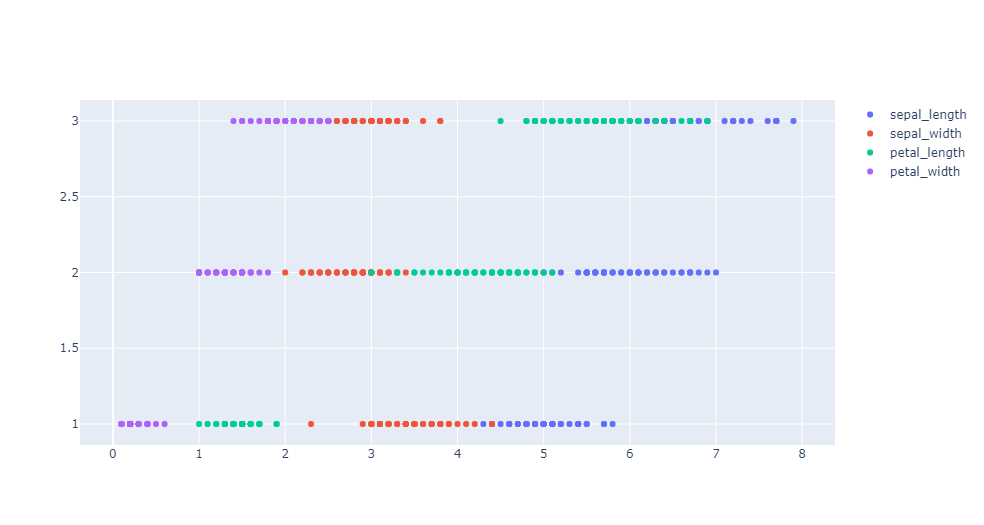
1 fig = go.Figure()
2 fig.add_scatter(y=df.species_id, x=df.sepal_length,  name='sepal_length',mode='markers')
3 fig.add_scatter(y=df.species_id, x=df.sepal_width,   name='sepal_width',mode='markers')
4 fig.add_scatter(y=df.species_id, x=df.petal_length,   name='petal_length',mode='markers')
5 fig.add_scatter(y=df.species_id, x=df.petal_width,   name='petal_width',mode='markers' )
6 fig.show()

 浙公网安备 33010602011771号