Docker日志管理--docker部署安装ELK (十一)--技术流ken
Docker logs
对于一个运行的容器,Docker 会将日志发送到 容器的 标准输出设备(STDOUT)和标准错误设备(STDERR),STDOUT 和 STDERR 实际上就是容器的控制台终端。
举个例子,用下面的命令运行 httpd 容器:
[root@host1 ~]# docker run -p 80:80 httpd
Unable to find image 'httpd:latest' locally
latest: Pulling from library/httpd
5e6ec7f28fb7: Pull complete
566e675a8212: Pull complete
ef5a8026039b: Pull complete
22ecb0106557: Pull complete
91cc511c603e: Pull complete
Digest: sha256:44daa8e932a32ab6e50636d769ca9a60ad412124653707e5ed59c0209c72f9b3
Status: Downloaded newer image for httpd:latest
AH00558: httpd: Could not reliably determine the server's fully qualified domain name, using 172.17.0.12. Set the 'ServerName' directive globally to suppress this message
AH00558: httpd: Could not reliably determine the server's fully qualified domain name, using 172.17.0.12. Set the 'ServerName' directive globally to suppress this message
[Mon Jan 28 08:55:25.168252 2019] [mpm_event:notice] [pid 1:tid 140652308325568] AH00489: Apache/2.4.38 (Unix) configured -- resuming normal operations
[Mon Jan 28 08:55:25.182578 2019] [core:notice] [pid 1:tid 140652308325568] AH00094: Command line: 'httpd -D FOREGROUND'
因为我们在启动日志的时候没有用-d 参数,httpd 容器以前台方式启动,日志会直接打印在当前的终端窗口。
如果加上-d 参数以后台方式运行容器,我们就看不到输出的日志了。
[root@host1 ~]# docker run -d -p 80:80 httpd
98d1fe5f1d074c345f578ef7767e8b2543977e61bb241f5629509c54502a7218
这种情况下,查看容器日志推荐的方法是用docker logs命令。
[root@host1 ~]# docker logs -f 98d1fe5f1d07
AH00558: httpd: Could not reliably determine the server's fully qualified domain name, using 172.17.0.12. Set the 'ServerName' directive globally to suppress this message
AH00558: httpd: Could not reliably determine the server's fully qualified domain name, using 172.17.0.12. Set the 'ServerName' directive globally to suppress this message
[Mon Jan 28 08:56:09.352502 2019] [mpm_event:notice] [pid 1:tid 139863955322048] AH00489: Apache/2.4.38 (Unix) configured -- resuming normal operations
[Mon Jan 28 08:56:09.353740 2019] [core:notice] [pid 1:tid 139863955322048] AH00094: Command line: 'httpd -D FOREGROUND'
docker logs能够打印出自容器启动以来完整的日志,并且-f 参数可以继续打印出新产生的日志,效果上与 Linux 命令tail -f 一样。
logging driver
Docker 提供了多种日志机制帮助用户从运行的容器中提取日志信息。这些机制被称作 logging driver。
Docker 的默认 logging driver 是json-file。
[root@host1 ~]# docker info | grep 'Logging Driver'
Logging Driver: json-file
jason-file会将容器的日志保存在 json 文件中,Docker 负责格式化其内容并输出到 STDOUT 和 STDERR。
我们可以在 Host 的容器目录中找到这个文件,器路径为 /var/lib/docker/containers/<contariner ID>/<contariner ID>-json.log
比如我们可以查看前面 httpd 容器 json 格式的日志文件。
可以看到下面四条日志记录
[root@host1 ~]# cat /var/lib/docker/containers/c633eb9e8ddd2f4fe134ebfdc157398d97c281552c8ae357f4f4879f8dc6483b/c633eb9e8ddd2f4fe134ebfdc157398d97c281552c8ae357f4f4879f8dc6483b-json.log
{"log":"AH00558: httpd: Could not reliably determine the server's fully qualified domain name, using 172.17.0.12. Set the 'ServerName' directive globally to suppress this message\n","stream":"stderr","time":"2019-01-28T09:08:22.784008521Z"}
{"log":"AH00558: httpd: Could not reliably determine the server's fully qualified domain name, using 172.17.0.12. Set the 'ServerName' directive globally to suppress this message\n","stream":"stderr","time":"2019-01-28T09:08:22.792051336Z"}
{"log":"[Mon Jan 28 09:08:22.792515 2019] [mpm_event:notice] [pid 1:tid 139740890547392] AH00489: Apache/2.4.38 (Unix) configured -- resuming normal operations\n","stream":"stderr","time":"2019-01-28T09:08:22.798741115Z"}
{"log":"[Mon Jan 28 09:08:22.793583 2019] [core:notice] [pid 1:tid 139740890547392] AH00094: Command line: 'httpd -D FOREGROUND'\n","stream":"stderr","time":"2019-01-28T09:08:22.798792809Z"}
ELK介绍
在开源的日志管理方案中,最出名的莫过于 ELK 了。ELK 是三个软件的合称:Elasticsearch、Logstash、Kibana。
Elasticsearch
一个近乎实时查询的全文搜索引擎。Elasticsearch 的设计目标就是要能够处理和搜索巨量的日志数据。
Logstash
读取原始日志,并对其进行分析和过滤,然后将其转发给其他组件(比如 Elasticsearch)进行索引或存储。Logstash 支持丰富的 Input 和 Output 类型,能够处理各种应用的日志。
Kibana
一个基于 JavaScript 的 Web 图形界面程序,专门用于可视化 Elasticsearch 的数据。Kibana 能够查询 Elasticsearch 并通过丰富的图表展示结果。用户可以创建 Dashboard 来监控系统的日志。
接下来讨论如何用 ELK 这组黄金搭档来监控 Docker 容器的日志。
ELK日志处理流程
下图展示了 Docker 部署环境下典型的 ELK 日志处理流程:
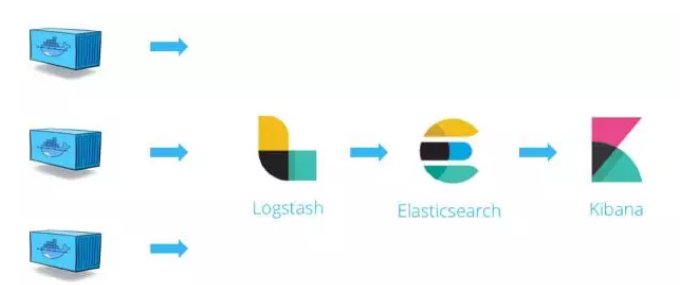
Logstash 负责从各个 Docker 容器中提取日志,Logstash将日志转发到 Elasticsearch 进行索引和保存,Kibana 分析和可视化数据。
部署ELK
第一步:安装
调整内存4个G以上
[root@host1 ~]# docker run -p 5601:5601 -p 9200:9200 -p 5044:5044 -it --name elk sebp/elk
我们使用的是 sebp/elk 这个现成的 image,里面已经包含了整个 ELK stack。容器启动后 ELK 各组件将分别监听如下端口:
5601 - Kibana web 接口
9200 - Elasticsearch JSON 接口
5044 - Logstash 日志接收接口
如果出现下面的错误
max virtual memory areas vm.max_map_count [65530] is too low, increase to at least [262144]
执行下面的命令
sysctl -w vm.max_map_count=262144
第二步:浏览器访问
先访问一下 Kibana http://[Host IP]:5601/ 看看效果

当前 Kibana 没有可显示的数据,因为当前 Elasticsearch 还没有任何日志数据。
接下来的工作就是将 Docker 的日志导入 ELK
filebeat
前面我们已经知道 Docker 会将容器日志记录到 /var/lib/docker/containers/<contariner ID>/<contariner ID>-json.log,那么只要我们能够将此文件发送给 ELK 就可以实现日志管理。
要实现这一步其实不难,因为 ELK 提供了一个配套小工具 Filebeat,它能将指定路径下的日志文件转发给 ELK。同时 Filebeat 很聪明,它会监控日志文件,当日志更新时,Filebeat 会将新的内容发送给 ELK。
第一步:安装filebeat
[root@ken ~]# curl -L -O https://artifacts.elastic.co/downloads/beats/filebeat/filebeat-6.5.4-x86_64.rpm
[root@ken ~]# rpm -vi filebeat-6.5.4-x86_64.rpm
Filebeat 可能已经有了更新的版本,请参考最新的安装文档 https://www.elastic.co/guide/en/beats/filebeat/current/filebeat-installation.html
第二步:配置filebeat
Filebeat 的配置文件为 /etc/filebeat/filebeat.yml,我们需要告诉 Filebeat 两件事:
-
监控哪些日志文件?
-
将日志发送到哪里?
首先回答第一个问题。
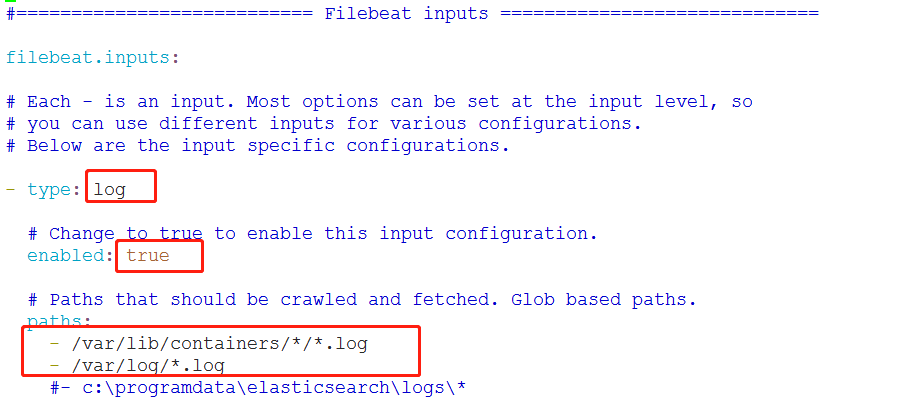
在 paths 中我们配置了两条路径:
/var/lib/docker/containers/*/*.log 是所有容器的日志文件。
/var/log/*.log 是 Host 操作系统的 log。
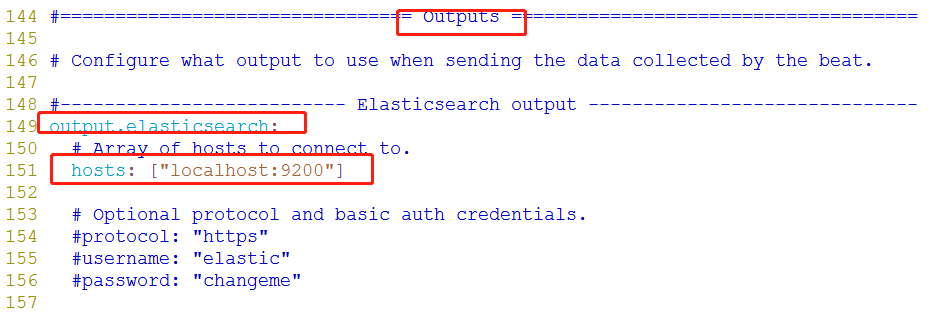
接下来告诉 Filebeat 将这些日志发送给 ELK。
Filebeat 可以将日志发送给 Elasticsearch 进行索引和保存;也可以先发送给 Logstash 进行分析和过滤,然后由 Logstash 转发给 Elasticsearch。
为了不引入过多的复杂性,我们这里将日志直接发送给 Elasticsearch。
下面的内容不需要任何的修改
第三步:启动filebeat
[root@ken ~]# systemctl start filebeat
第四步:首先需要配置一个index pattern即告诉 Kibana 查询和分析 Elasticsearch 中的哪些日志。
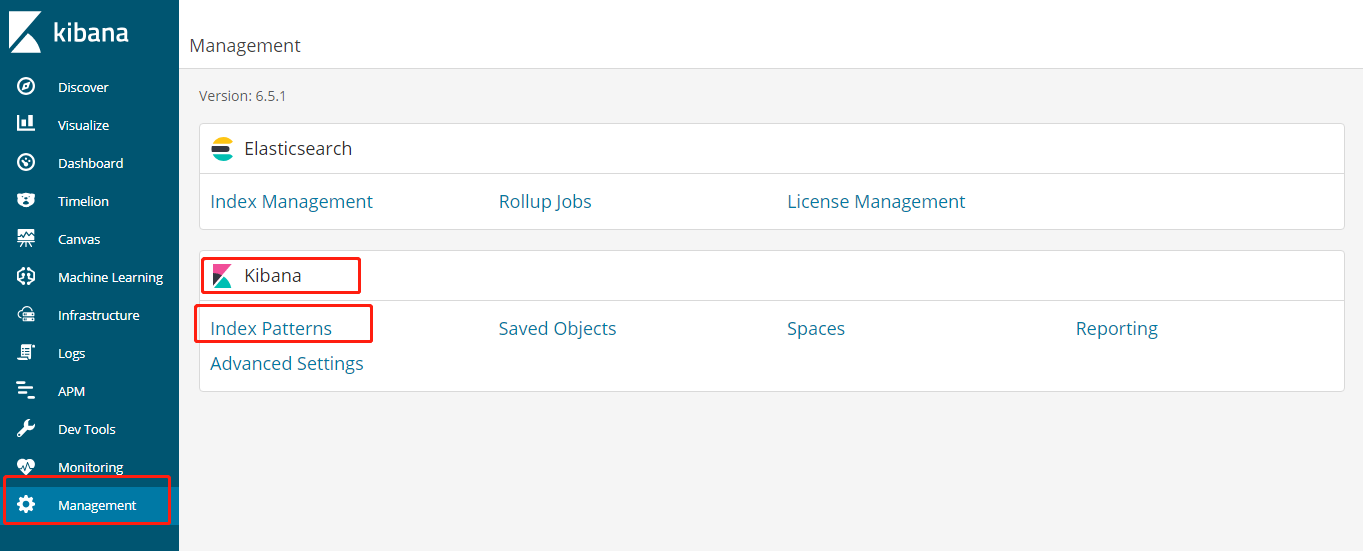
指定 index pattern 为 filebeat-*,这与 Elasticsearch 中的 index一致。
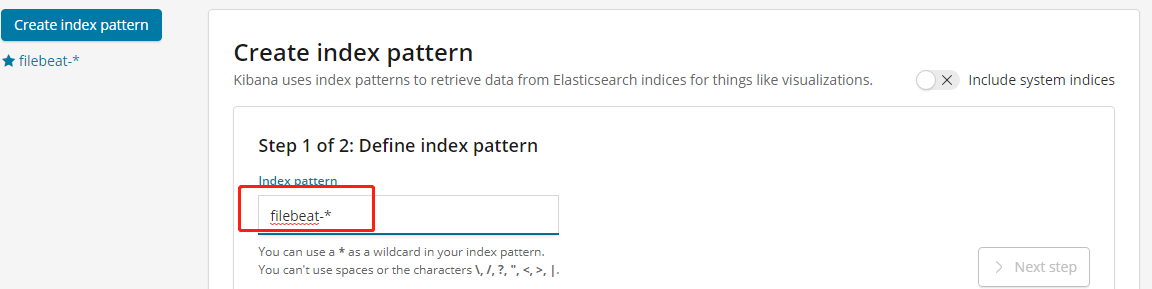
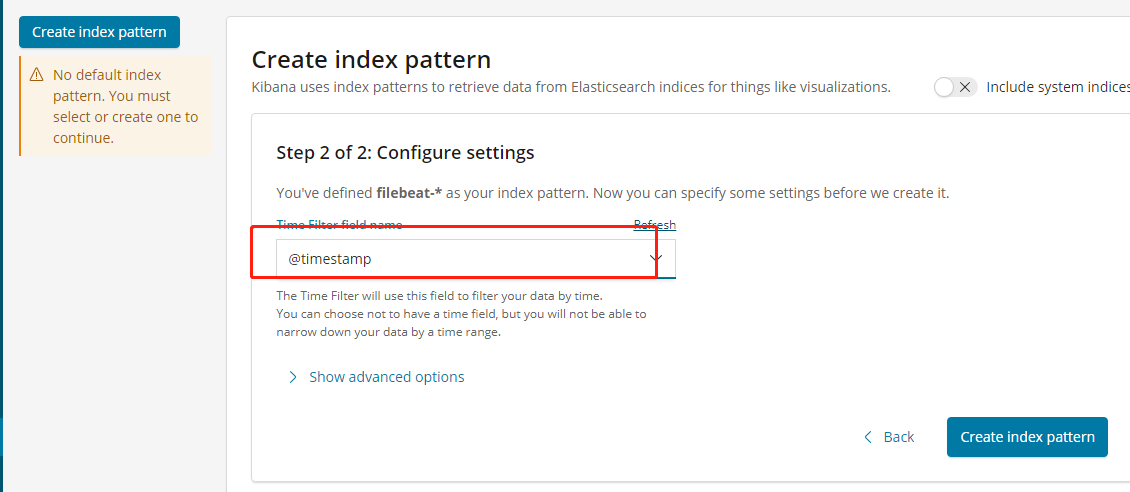
Time-field name 选择 @timestamp。
点击 Create 创建 index pattern。
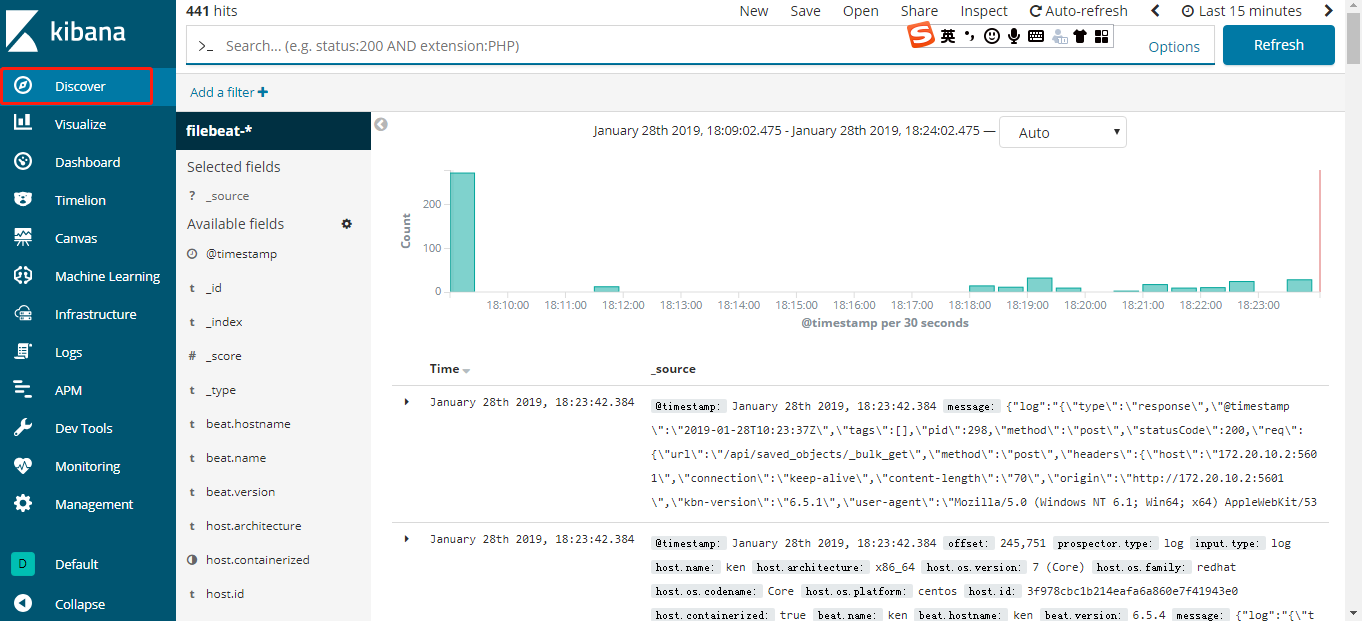
第五步:查看日志
点击 Kibana 左侧Discover 菜单,便可看到容器和 syslog 日志信息。
第六步:测试
下面我们启动一个新的容器,该容器将向控制台打印信息,模拟日志输出。
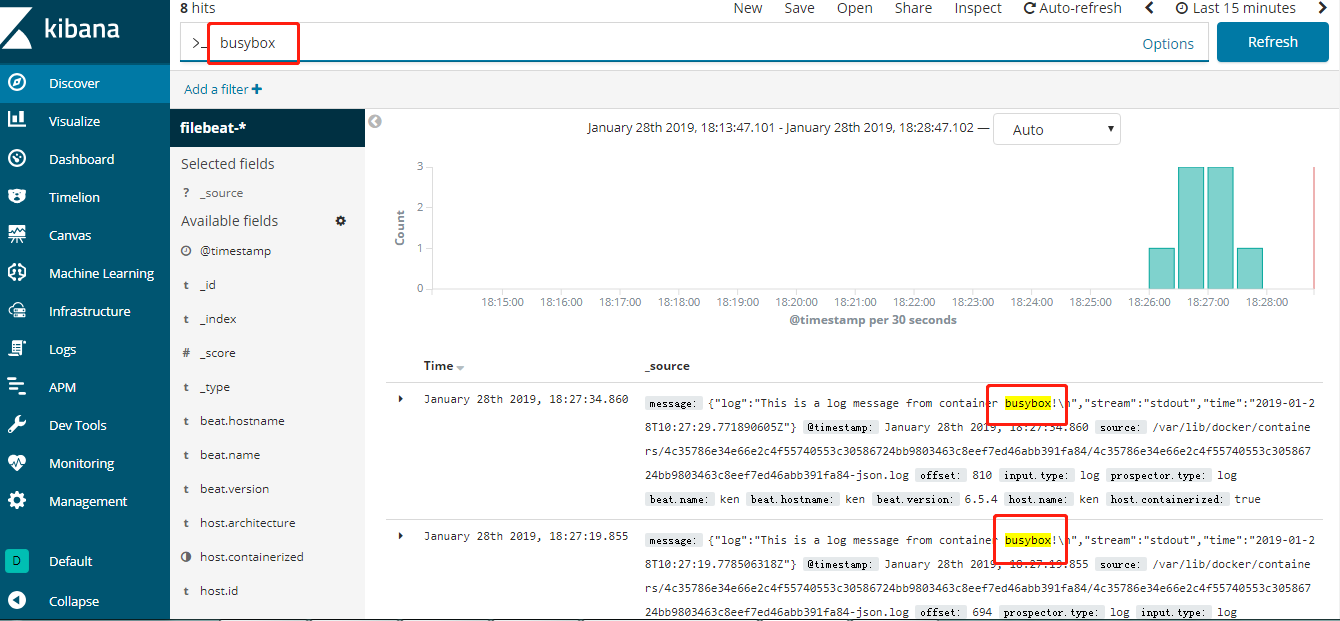
[root@ken ~]# docker run busybox sh -c 'while true; do echo "This is a log message from container busybox!"; sleep 10; done;'
This is a log message from container busybox!
This is a log message from container busybox!
刷新 Kibana 页面马上就能看到 busybox 的日志。
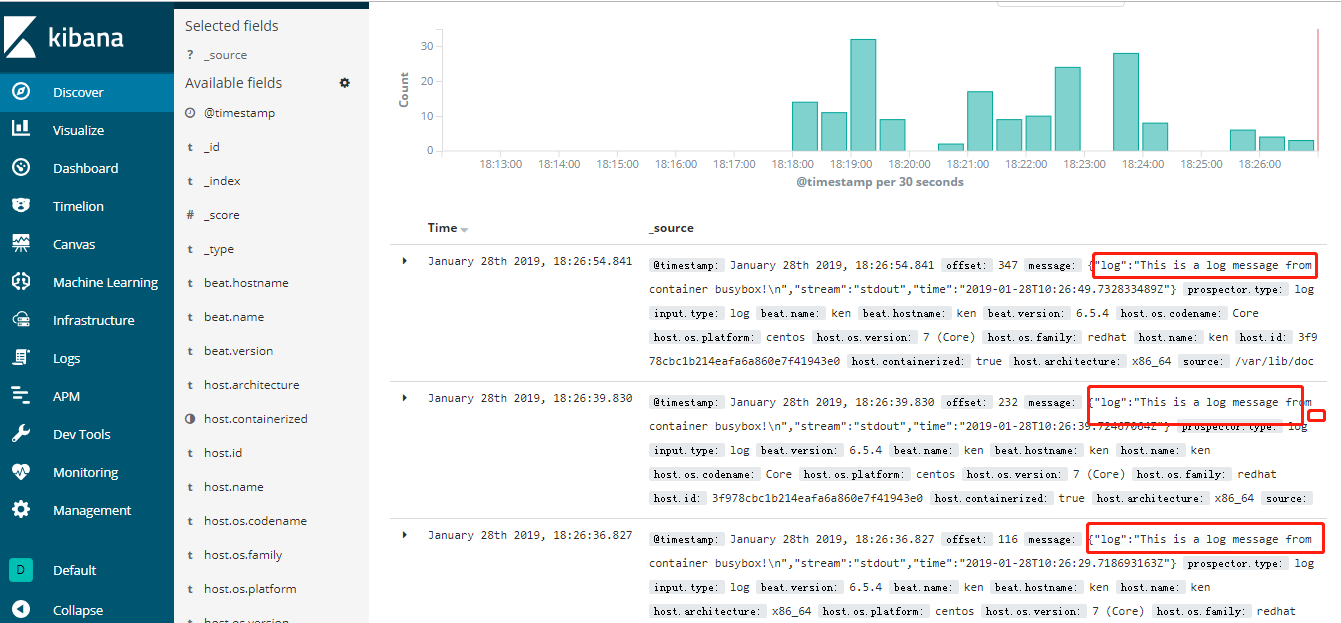
Kibana 也提供了强大的查询功能,比如输入关键字busybox 能搜索出所有匹配的日志条目。

 浙公网安备 33010602011771号