
Python分析股票数据可视化
一、选题背景
股票(stock)是股份公司所有权的一部分,也是发行的所有权凭证,是股份公司为筹集资金而发行给各个股东作为持股凭证并借以取得股息和红利的一种有价证券。
要达到的预期目标:
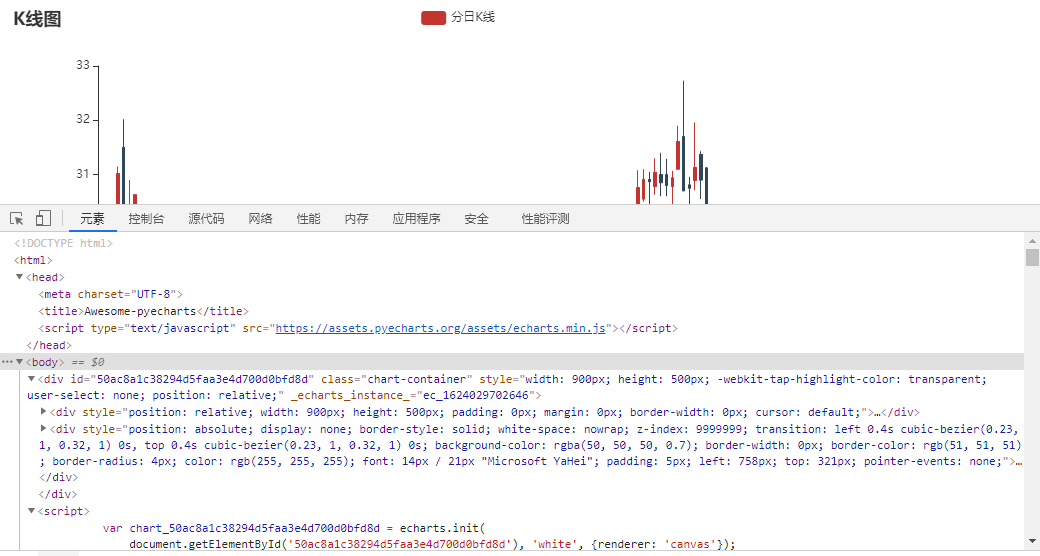
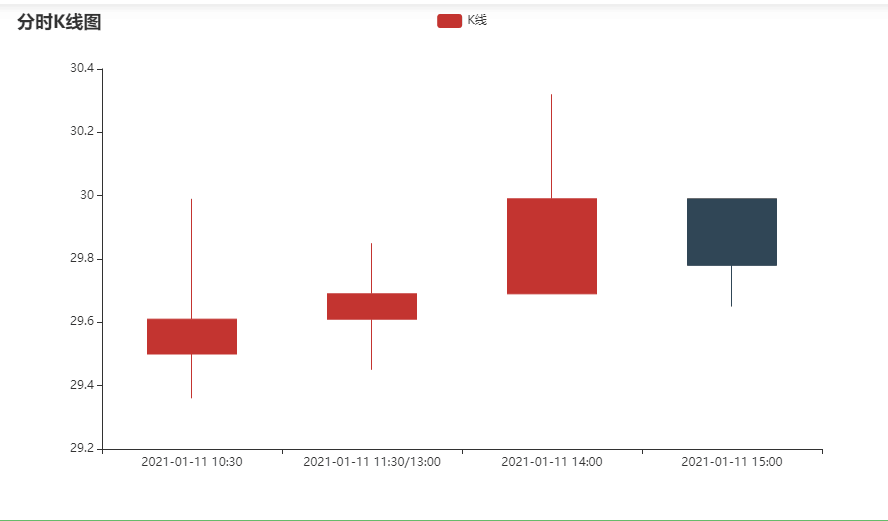
1.根据采集的股票价格数据绘制股票的K线图(分时K线,日K线)
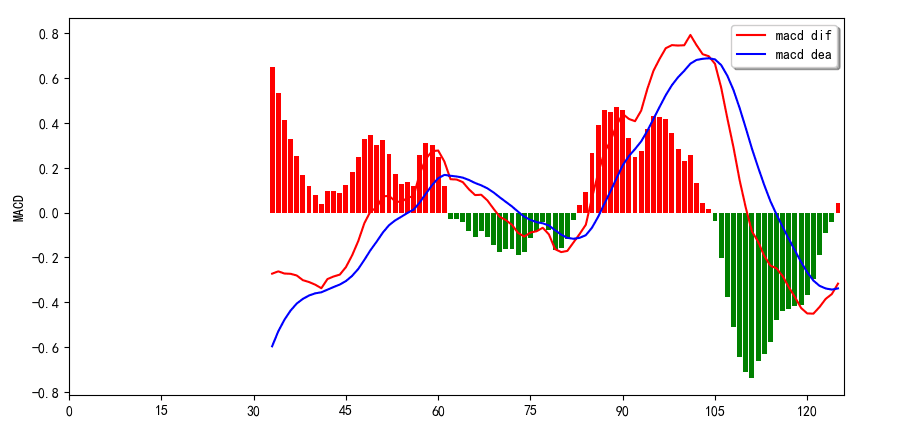
2.根据每日价格计算一种股票指标(MACD,JDK),并绘制出相应的折线图
二、爬虫方案设计
1.方案名称:
股本分析
2.爬取的内容与数据特征分析:
通过网站采集股票的价格数据
3.数据来源:
GitHub中文社区
4.方案概述:
查找参考文献,学习相似案例所采用的技术路线,实现方法和所用技术,分析网页结构,寻求爬取数据位置,将获取数据通过绘制图表形式展示出来
三、网站页面结构分析
1,主题页面的结构与特性分析
通过浏览器“审查元素”查看源代码,如下图所示:
四、程序设计
1.创建数据库文件
 1  #将每天的股票的历史数据插入表1
 2     def InsertTB1(self,everyday,openprice,closeprice,lowestprice,highestprice):
 3         self.OpenDB()
 4         sql='''insert into everyday_gp  values (?,?,?,?,?)'''
 5         self.cur.execute(sql,(everyday,openprice,closeprice,lowestprice,highestprice))
 6         self.close()
 7
 8     #将当天每分钟的股票价格插入表2
 9     def InsertTB2(self,everyminute,nowprice):
10         self.OpenDB()
11         sql='''insert into everymin_gp values (?,?)'''
12         self.cur.execute(sql,(everyminute,nowprice))
13         self.close()
14
15     #查询表1每天的股价
16     def GetDayData(self):
17         self.OpenDB()
18         sql='''select * from everyday_gp '''
19         self.cur.execute(sql)
20         result=self.cur.fetchall()
21         self.close()
22         return result
23
24     #查询表2每分钟的股价
25     def GetMinData(self):
26         self.OpenDB()
27         sql='''select * from everymin_gp'''
28         self.cur.execute(sql)
29         result=self.cur.fetchall()
30         self.close()
31         return result
32
33     #打开数据库,有就打开,没有就创建
34     def OpenDB(self):
35         self.db=sqlite3.connect(self.DBname)
36         self.cur=self.db.cursor()
37
38     #释放游标,关闭数据库
39     def close(self):
40         self.db.commit()
41         self.db.close()
42
43 if __name__=='__main__':
44     DB=DataBase()
45     DB.CreateTable1()
46     DB.CreateTable2()
2.编写蜘蛛文件
 1 import requests
 2 import json
 3 from DataBase import DataBase
 4 class Spider:
 5     def __init__(self):
 6         self.db=DataBase()
 7         #股票代码
 8         self.Stock_code="000002"
 9     #从网易财经上爬取某只股票的历史价格并插入到表1保存
10     def daySpider(self):
11         start_time=20200701
12         end_time=20201231
13         url="http://quotes.money.163.com/service/chddata.html?code=1"\
14                 +self.Stock_code+"&start="+str(start_time)+"&end="+str(end_time)+\
15                 "&fields=TCLOSE;HIGH;LOW;TOPEN;LCLOSE;CHG;PCHG;TURNOVER;VOTURNOVER;VATURNOVER;TCAP;MCAP"
16         doc=requests.get(url)
17         data=doc.text.splitlines()
18         n=len(data)
19         for i in range(n-1):
20             l=data[-i-1].split(',')
21             self.db.InsertTB1(l[0],l[6],l[3],l[5],l[4])
22
23     #从东方财富网爬取某只股票的一天里面9:30到15:00每分钟的股票价格并插入表2保存
24     def minSpider(self):
25         url='http://pdfm.eastmoney.com/EM_UBG_PDTI_Fast/api/js?rtntype=5&id='+self.Stock_code+\
26         '2&type=r&iscr=false'
27         doc=requests.get(url)
28         l=doc.text.replace('(','').replace(')','')
29         data=json.loads(l)
30         for i in data['data']:
31             l=i.split(',')
32             self.db.InsertTB2(l[0],l[1])
33
34 if __name__=='__main__':
35     spider=Spider()
36     spider.daySpider()
37     spider.minSpider()
3.编写绘制K线代码
 1 from DataBase import DataBase
 2 from pyecharts import options as opts
 3 from pyecharts.charts import Kline #pycharts带有画k线的函数
 4 import matplotlib.pyplot as plt
 5 import pandas as pd
 6 import numpy as np
 7 import talib as ta
 8 plt.rcParams['font.sans-serif']=['SimHei'] #用来正常显示中文标签
 9 plt.rcParams['axes.unicode_minus']=False #用来正常显示负号
10
11 class PlotK:
12     def __init__(self):
13         self.db=DataBase()
绘制分日K线图
 1 def K1(self):
 2         data=self.db.GetDayData()
 3         time=[]#装日期
 4         price=[]#装日的开盘价,收盘价,最高价,最低价
 5         for i in data:
 6             time.append(i[0])
 7             price.append(i[1:])
 8         kline=Kline()
 9         kline.add_xaxis(time)
10         kline.add_yaxis("分日K线",price)
11         kline.set_global_opts(title_opts=opts.TitleOpts(title="K线图"))
12         kline.render("分日K线.html")

绘制分时K线图
 1 def K2(self):
 2         data=self.db.GetMinData()
 3         time=[]
 4         price=[]
 5         for i in data:
 6             time.append(i[0])
 7             price.append(i[1])
 8         Open=0
 9         Close=0
10         Low=0
11         High=0
12         price2=[]
13         for i in range(int(len(price)/60)):#计算出每个小时的开盘价,收盘价,最高价,最低价
14             d=[]
15             Open=price[i*60]
16             Close=price[60*(i+1)]
17             Low=min(price[i*60:60*(i+1)])
18             High=max(price[i*60:60*(i+1)])
19             d.append(Open)
20             d.append(Close)
21             d.append(Low)
22             d.append(High)
23             price2.append(d)
24         date=[]
25         for j in range(len(time)):#生成每天的小时时间
26             year=time[j].split(' ')[0]
27             if j%240==0 and j!=0:
28                 date.append(year+" 10:30")
29                 date.append(year+" 11:30/13:00")
30                 date.append(year+" 14:00")
31                 date.append(year+" 15:00")
32                 if j==len(time)-1:
33                     year=''
34                 else:
35                     year=time[j+1].split(' ')[0]
36         kline=Kline()
37         kline.add_xaxis(date)
38         kline.add_yaxis("K线", price2)
39         kline.set_global_opts(
40         title_opts=opts.TitleOpts(title="分时K线图"))
41         kline.render('分时K线.html')
绘制JDK图
 1 def JDK(self):
 2         data=self.db.GetDayData()
 3         time=[]
 4         price=[]
 5         for i in range(len(data)):
 6             time.append(data[i][0])
 7             price.append(data[i][1:])
 8         fig = plt.figure(figsize=(5,2), dpi=100,facecolor="white")
 9         price=pd.DataFrame(price,columns=['open','close','low','high'])
10         K,D=ta.STOCH(price.high.values, price.low.values, price.close.values,
11                         fastk_period=9, slowk_period=3, slowk_matype=0, slowd_period=3, slowd_matype=0)
12         J=3*K-2*D
13         plt.plot(np.arange(0, len(time)),K, 'blue', label='K')  # K
14         plt.plot(np.arange(0, len(time)),D, 'g--', label='D')  # D
15         plt.plot(np.arange(0, len(time)),J, 'r-', label='J')  # J
16         plt.legend(loc='best', shadow=True, fontsize='10')
17         plt.ylabel(u"KDJ")
18         plt.xlabel("日期")
19         plt.xlim(0, len(time))  # 设置一下x轴的范围
20         x=[]
21         lable=[]
22         for i in range(0,len(time),15):
23             x.append(i)
24             lable.append(time[i])
25         # X轴刻度设定 每15天标一个日期, 标签设置为日期
26         plt.xticks(x,lable)
27         plt.xticks(rotation=45)
28         plt.show()

绘制MACD图
 1 def MACD(self):
 2         data=self.db.GetDayData()
 3         fig = plt.figure(figsize=(5,2), dpi=100,facecolor="white")
 4         time=[]
 5         price=[]
 6         for i in range(len(data)):
 7             time.append(data[i][0])
 8             price.append(data[i][1:])
 9         price=pd.DataFrame(price,columns=['open','close','low','high'])
10         macd_dif, macd_dea, macd_bar = ta.MACD(price.close.values, fastperiod=12, slowperiod=26, signalperiod=9)
11         plt.plot(np.arange(0, len(time)), macd_dif, 'red', label='macd dif')  # dif
12         plt.plot(np.arange(0, len(time)), macd_dea, 'blue', label='macd dea')  # dea
13
14         bar_red = np.where(macd_bar > 0, 2 * macd_bar, 0)# 绘制BAR>0 柱状图
15         bar_green = np.where(macd_bar < 0, 2 * macd_bar, 0)# 绘制BAR<0 柱状图
16         plt.bar(np.arange(0, len(time)), bar_red, facecolor='red')
17         plt.bar(np.arange(0, len(time)), bar_green, facecolor='green')
18
19         plt.legend(loc='best',shadow=True, fontsize ='10')
20         plt.ylabel(u"MACD")
21         plt.xlim(0,len(time)) #设置一下x轴的范围
22         plt.xticks(range(0,len(time),15))#X轴刻度设定 每15天标一个日期
23         plt.show()
1 if __name__=='__main__':
2     plot=PlotK()
3     plot.JDK()
4     plot.K1()
5     plot.K2()
6     plot.MACD()
所有代码
  1 from DataBase import DataBase
  2 from pyecharts import options as opts
  3 from pyecharts.charts import Kline #pycharts带有画k线的函数
  4 import matplotlib.pyplot as plt
  5 import pandas as pd
  6 import numpy as np
  7 import talib as ta
  8 plt.rcParams['font.sans-serif']=['SimHei'] #用来正常显示中文标签
  9 plt.rcParams['axes.unicode_minus']=False #用来正常显示负号
 10
 11 class PlotK:
 12     def __init__(self):
 13         self.db=DataBase()
 14
 15     def K1(self):
 16         data=self.db.GetDayData()
 17         time=[]#装日期
 18         price=[]#装日的开盘价,收盘价,最高价,最低价
 19         for i in data:
 20             time.append(i[0])
 21             price.append(i[1:])
 22         kline=Kline()
 23         kline.add_xaxis(time)
 24         kline.add_yaxis("分日K线",price)
 25         kline.set_global_opts(title_opts=opts.TitleOpts(title="K线图"))
 26         kline.render("分日K线.html")
 27
 28     def K2(self):
 29         data=self.db.GetMinData()
 30         time=[]
 31         price=[]
 32         for i in data:
 33             time.append(i[0])
 34             price.append(i[1])
 35         Open=0
 36         Close=0
 37         Low=0
 38         High=0
 39         price2=[]
 40         for i in range(int(len(price)/60)):#计算出每个小时的开盘价,收盘价,最高价,最低价
 41             d=[]
 42             Open=price[i*60]
 43             Close=price[60*(i+1)]
 44             Low=min(price[i*60:60*(i+1)])
 45             High=max(price[i*60:60*(i+1)])
 46             d.append(Open)
 47             d.append(Close)
 48             d.append(Low)
 49             d.append(High)
 50             price2.append(d)
 51         date=[]
 52         for j in range(len(time)):#生成每天的小时时间
 53             year=time[j].split(' ')[0]
 54             if j%240==0 and j!=0:
 55                 date.append(year+" 10:30")
 56                 date.append(year+" 11:30/13:00")
 57                 date.append(year+" 14:00")
 58                 date.append(year+" 15:00")
 59                 if j==len(time)-1:
 60                     year=''
 61                 else:
 62                     year=time[j+1].split(' ')[0]
 63         kline=Kline()
 64         kline.add_xaxis(date)
 65         kline.add_yaxis("K线", price2)
 66         kline.set_global_opts(
 67         title_opts=opts.TitleOpts(title="分时K线图"))
 68         kline.render('分时K线.html')
 69
 70     def JDK(self):
 71         data=self.db.GetDayData()
 72         time=[]
 73         price=[]
 74         for i in range(len(data)):
 75             time.append(data[i][0])
 76             price.append(data[i][1:])
 77         fig = plt.figure(figsize=(5,2), dpi=100,facecolor="white")
 78         price=pd.DataFrame(price,columns=['open','close','low','high'])
 79         K,D=ta.STOCH(price.high.values, price.low.values, price.close.values,
 80                         fastk_period=9, slowk_period=3, slowk_matype=0, slowd_period=3, slowd_matype=0)
 81         J=3*K-2*D
 82         plt.plot(np.arange(0, len(time)),K, 'blue', label='K')  # K
 83         plt.plot(np.arange(0, len(time)),D, 'g--', label='D')  # D
 84         plt.plot(np.arange(0, len(time)),J, 'r-', label='J')  # J
 85         plt.legend(loc='best', shadow=True, fontsize='10')
 86         plt.ylabel(u"KDJ")
 87         plt.xlabel("日期")
 88         plt.xlim(0, len(time))  # 设置一下x轴的范围
 89         x=[]
 90         lable=[]
 91         for i in range(0,len(time),15):
 92             x.append(i)
 93             lable.append(time[i])
 94         # X轴刻度设定 每15天标一个日期, 标签设置为日期
 95         plt.xticks(x,lable)
 96         plt.xticks(rotation=45)
 97         plt.show()
 98
 99     def MACD(self):
100         data=self.db.GetDayData()
101         fig = plt.figure(figsize=(5,2), dpi=100,facecolor="white")
102         time=[]
103         price=[]
104         for i in range(len(data)):
105             time.append(data[i][0])
106             price.append(data[i][1:])
107         price=pd.DataFrame(price,columns=['open','close','low','high'])
108         macd_dif, macd_dea, macd_bar = ta.MACD(price.close.values, fastperiod=12, slowperiod=26, signalperiod=9)
109         plt.plot(np.arange(0, len(time)), macd_dif, 'red', label='macd dif')  # dif
110         plt.plot(np.arange(0, len(time)), macd_dea, 'blue', label='macd dea')  # dea
111
112         bar_red = np.where(macd_bar > 0, 2 * macd_bar, 0)# 绘制BAR>0 柱状图
113         bar_green = np.where(macd_bar < 0, 2 * macd_bar, 0)# 绘制BAR<0 柱状图
114         plt.bar(np.arange(0, len(time)), bar_red, facecolor='red')
115         plt.bar(np.arange(0, len(time)), bar_green, facecolor='green')
116
117         plt.legend(loc='best',shadow=True, fontsize ='10')
118         plt.ylabel(u"MACD")
119         plt.xlim(0,len(time)) #设置一下x轴的范围
120         plt.xticks(range(0,len(time),15))#X轴刻度设定 每15天标一个日期
121         plt.show()
122
123
124 if __name__=='__main__':
125     plot=PlotK()
126     plot.JDK()
127     plot.K1()
128     plot.K2()
129     plot.MACD()
130
131 import sqlite3
132 class DataBase:
133     def __init__(self):
134         #自定义数据库名字
135         self.DBname='D:/股票价格.db'
136
137     #创建存储每天股票价格的数据表
138     def CreateTable1(self):
139         self.OpenDB()
140         #sql语句
141         sql='''create table everyday_gp (everyday datetime,openprice numeric(6,2),
142         closeprice numeric(6,2),lowestprice numeric(6,2),highestprice numeric(6.2))'''
143         self.cur.execute(sql)
144         self.close()
145
146     #创建存储当天每分钟股价的数据表
147     def CreateTable2(self):
148         self.OpenDB()
149         #sql语句
150         sql='''create table everymin_gp (everyminute datetime,nowprice numeric(6,2))'''
151         self.cur.execute(sql)
152         self.close()
153
154     #将每天的股票的历史数据插入表1
155     def InsertTB1(self,everyday,openprice,closeprice,lowestprice,highestprice):
156         self.OpenDB()
157         sql='''insert into everyday_gp  values (?,?,?,?,?)'''
158         self.cur.execute(sql,(everyday,openprice,closeprice,lowestprice,highestprice))
159         self.close()
160
161     #将当天每分钟的股票价格插入表2
162     def InsertTB2(self,everyminute,nowprice):
163         self.OpenDB()
164         sql='''insert into everymin_gp values (?,?)'''
165         self.cur.execute(sql,(everyminute,nowprice))
166         self.close()
167
168     #查询表1每天的股价
169     def GetDayData(self):
170         self.OpenDB()
171         sql='''select * from everyday_gp '''
172         self.cur.execute(sql)
173         result=self.cur.fetchall()
174         self.close()
175         return result
176
177     #查询表2每分钟的股价
178     def GetMinData(self):
179         self.OpenDB()
180         sql='''select * from everymin_gp'''
181         self.cur.execute(sql)
182         result=self.cur.fetchall()
183         self.close()
184         return result
185
186     #打开数据库,有就打开,没有就创建
187     def OpenDB(self):
188         self.db=sqlite3.connect(self.DBname)
189         self.cur=self.db.cursor()
190
191     #释放游标,关闭数据库
192     def close(self):
193         self.db.commit()
194         self.db.close()
195
196 if __name__=='__main__':
197     DB=DataBase()
198     DB.CreateTable1()
199     DB.CreateTable2()
200
201 import requests
202 import json
203 from DataBase import DataBase
204 class Spider:
205     def __init__(self):
206         self.db=DataBase()
207         #股票代码
208         self.Stock_code="000002"
209     #从网易财经上爬取某只股票的历史价格并插入到表1保存
210     def daySpider(self):
211         start_time=20200701
212         end_time=20201231
213         url="http://quotes.money.163.com/service/chddata.html?code=1"\
214                 +self.Stock_code+"&start="+str(start_time)+"&end="+str(end_time)+\
215                 "&fields=TCLOSE;HIGH;LOW;TOPEN;LCLOSE;CHG;PCHG;TURNOVER;VOTURNOVER;VATURNOVER;TCAP;MCAP"
216         doc=requests.get(url)
217         data=doc.text.splitlines()
218         n=len(data)
219         for i in range(n-1):
220             l=data[-i-1].split(',')
221             self.db.InsertTB1(l[0],l[6],l[3],l[5],l[4])
222
223     #从东方财富网爬取某只股票的一天里面9:30到15:00每分钟的股票价格并插入表2保存
224     def minSpider(self):
225         url='http://pdfm.eastmoney.com/EM_UBG_PDTI_Fast/api/js?rtntype=5&id='+self.Stock_code+\
226         '2&type=r&iscr=false'
227         doc=requests.get(url)
228         l=doc.text.replace('(','').replace(')','')
229         data=json.loads(l)
230         for i in data['data']:
231             l=i.split(',')
232             self.db.InsertTB2(l[0],l[1])
233
234 if __name__=='__main__':
235     spider=Spider()
236     spider.daySpider()
237     spider.minSpider()
五、总结
股票和基金一直是热门的话题,很多周围的人都选择不同种类的理财方式。就股票而言,肯定是短时间内收益最大化,这里我们通过用python爬虫的方法,将获取的股票的数据,通过直观的图表形式反馈给客户,供客户去分析更好的买到相应的股票。

