
之前介绍了一下 Mesh 对象以及渐变色效果:ArcGIS JSAPI 学习教程 - 创建渐变色材质的自定义几何体
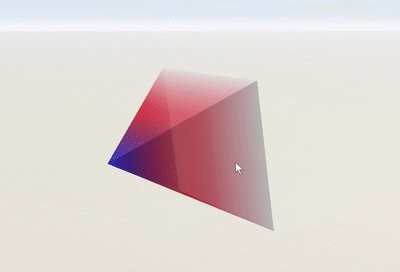
现在简单介绍一下,点击高亮 Mesh 对象。
本文包括 核心代码、完整代码以及在线示例。
核心代码
点击高亮过程:监听点击事件、命中测试、设置高亮(包括关闭上一个高亮)。
// 点击事件命中的高亮显示
let highlight;
// 处理点击事件以高亮显示金字塔
view.on("click", function (event) {
// 执行点击事件的命中测试
view.hitTest(event).then(function (response) {
// 过滤出点击事件命中的图层
const results = response.results.filter(function (result) {
return result.graphic.layer === graphicsLayer;
});
if (results.length > 0) {
const graphic = results[0].graphic;
// 高亮显示点击事件命中的图层
view.whenLayerView(graphicsLayer).then((layerView_) => {
if (!highlight) {
highlight = layerView_.highlight(graphic);
}
});
} else {
// 点击事件未命中任何图层时,移除高亮显示
highlight?.remove();
highlight = null;
}
});
});
完整代码
<!DOCTYPE html>
  <html>
    <head>
        <meta charset="utf-8">
          <meta name="viewport" content="initial-scale=1, maximum-scale=1, user-scalable=no">
        <title>ArcGIS JS API 点击高亮 mesh</title>
          <style>
            html, body, #viewDiv {
            padding: 0;
            margin: 0;
            height: 100%;
            width: 100%;
            }
          </style>
          <!-- 引入ArcGIS JS API样式和脚本 -->
          <script type="text/javascript" src="https://openlayers.vip/examples/resources/dat_gui/dat.gui.js"></script>
            <link rel="stylesheet" type="text/css" href="https://openlayers.vip/examples/resources/dat_gui/dat.gui.css"/>
            <!-- 引入ArcGIS JS API样式和脚本 -->
              <link rel="stylesheet" href="https://openlayers.vip/arcgis_api/4.33/esri/themes/light/main.css"/>
            <script src="https://openlayers.vip/arcgis_api/4.33/init.js"></script>
              <script>
                var _hmt = _hmt || [];
                (function () {
                var hm = document.createElement("script");
                hm.src = "https://hm.baidu.com/hm.js?f80a36f14f8a73bb0f82e0fdbcee3058";
                var s = document.getElementsByTagName("script")[0];
                s.parentNode.insertBefore(hm, s);
                })();
              </script>
              <script>
                require([
                "esri/Map",
                "esri/views/SceneView",
                "esri/WebScene",
                "esri/geometry/Mesh",
                "esri/geometry/Point",
                "esri/geometry/SpatialReference",
                "esri/Graphic",
                "esri/layers/GraphicsLayer",
                ], function (Map, SceneView, WebScene, Mesh, Point, SpatialReference, Graphic,
                GraphicsLayer,
                ) {
                const spatialReference = SpatialReference.WebMercator;
                const graphicsLayer = new GraphicsLayer();
                const scene = new Map({
                layers: [graphicsLayer]
                })
                const view = new SceneView({
                map: scene,
                container: "viewDiv",
                qualityProfile: 'high',
                camera: {
                position: {
                x: 12957235.377120316,
                y: 4863943.339089994,
                z: 540.7203787067715,
                spatialReference
                },
                tilt: 60
                }
                });
                // 视椎体顶点
                const cameraPositionGeographic = [12121597.211481025, 4060392.3041098495, 673.0166350845248, 12121688.817691227, 4060067.135944337, 825.3678379664198, 12121265.251479909, 4060329.6045611626, 825.3678379654884, 12121245.121950569, 4060297.137362419, 571.5452030794695, 12121668.70426917, 4060034.659804911, 571.5452030794695]
                // 透明度
                const globalAlpha = 0.7;
                // 创建渐变色
                function createLinearGradient() {
                const canvas = document.createElement("canvas");
                const width = 32 * 32;
                const height = 32 * 32;
                canvas.width = width;
                canvas.height = height;
                const ctx = canvas.getContext("2d");
                ctx.globalAlpha = globalAlpha;
                // Create the linear gradient with which to fill the canvas
                const gradient = ctx.createLinearGradient(0, 0, width, 0);
                // 这里创建三个渐变色,可随意调整
                gradient.addColorStop(0, "#0000ff");
                gradient.addColorStop(0.5, "#ff0000");
                gradient.addColorStop(1, "#ffffff");
                // Fill the canvas with the gradient pattern
                ctx.fillStyle = gradient;
                ctx.fillRect(0, 0, width, height);
                return canvas;
                }
                const uv = 1;
                // 材质
                const material = {
                colorTexture: {
                data: createLinearGradient(),
                wrap: 'clamp'
                },
                };
                // 创建 box
                const mesh = new Mesh({
                // 顶点属性
                vertexAttributes: {
                position: cameraPositionGeographic,
                uv: [
                0, 0,
                uv, 0,
                uv, 0,
                uv, 0,
                uv, 0,
                ]
                },
                // 三角面材质纹理
                components: [
                {
                faces: [0, 2, 1],
                material
                },
                {
                faces: [0, 2, 3],
                material
                },
                {
                faces: [0, 3, 4],
                material
                },
                {
                faces: [0, 4, 1],
                material
                },
                {
                faces: [1, 2, 4],
                material: {
                color: "transparent"
                }
                },
                {
                faces: [2, 3, 4],
                material: {
                color: "transparent"
                }
                }],
                spatialReference,
                })
                const conusGraphic = new Graphic({
                // 缩放至矩阵范围
                geometry: mesh,
                symbol: {
                type: "mesh-3d",
                symbolLayers: [
                {
                type: "fill",
                },
                ],
                },
                });
                // 将圆柱体添加到视图
                graphicsLayer.add(conusGraphic);
                // 当视图加载完成后执行
                view.when(() => {
                // 将视图缩放到圆柱体范围
                view.goTo({
                target: mesh,
                tilt: 90,
                heading: 150
                }, {duration: 1500});
                });
                // 点击事件命中的高亮显示
                let highlight;
                // 处理点击事件以高亮显示金字塔
                view.on("click", function (event) {
                // 执行点击事件的命中测试
                view.hitTest(event).then(function (response) {
                // 过滤出点击事件命中的图层
                const results = response.results.filter(function (result) {
                return result.graphic.layer === graphicsLayer;
                });
                if (results.length > 0) {
                const graphic = results[0].graphic;
                // 高亮显示点击事件命中的图层
                view.whenLayerView(graphicsLayer).then((layerView_) => {
                if (!highlight) {
                highlight = layerView_.highlight(graphic);
                }
                });
                } else {
                // 点击事件未命中任何图层时,移除高亮显示
                highlight?.remove();
                highlight = null;
                }
                });
                });
                });
              </script>
            </head>
            <body>
            <div id="viewDiv"></div>
            </body>
          </html>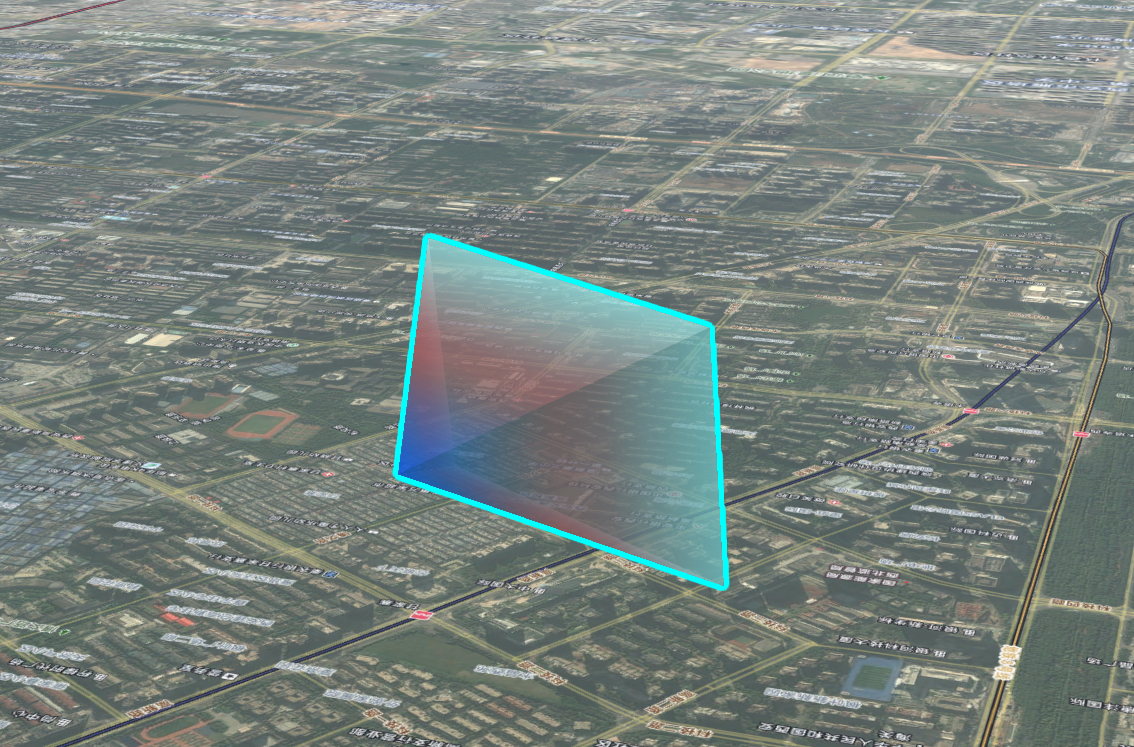
在线示例
ArcGIS Maps SDK for JavaScript 在线示例:自定义几何体(Mesh)点击高亮


 浙公网安备 33010602011771号