<!DOCTYPE html>
<html style="height: 100%">
<head>
<meta charset="utf-8">
</head>
<body style="height: 100%; margin: 0">
<div id="container" style="height: 100%"></div>
<script type="text/javascript" src="https://cdn.jsdelivr.net/npm/echarts@5.3.0/dist/echarts.min.js"></script>
<!-- Uncomment this line if you want to dataTool extension
<script type="text/javascript" src="https://cdn.jsdelivr.net/npm/echarts@5.3.0/dist/extension/dataTool.min.js"></script>
-->
<!-- Uncomment this line if you want to use gl extension
<script type="text/javascript" src="https://cdn.jsdelivr.net/npm/echarts-gl@2/dist/echarts-gl.min.js"></script>
-->
<!-- Uncomment this line if you want to echarts-stat extension
<script type="text/javascript" src="https://cdn.jsdelivr.net/npm/echarts-stat@latest/dist/ecStat.min.js"></script>
-->
<!-- Uncomment this line if you want to use map
<script type="text/javascript" src="https://cdn.jsdelivr.net/npm/echarts@5.3.0/map/js/china.js"></script>
<script type="text/javascript" src="https://cdn.jsdelivr.net/npm/echarts@5.3.0/map/js/world.js"></script>
-->
<!-- Uncomment these two lines if you want to use bmap extension
<script type="text/javascript" src="https://api.map.baidu.com/api?v=2.0&ak=<Your Key Here>"></script>
<script type="text/javascript" src="https://cdn.jsdelivr.net/npm/echarts@{{version}}/dist/extension/bmap.min.js"></script>
-->
<script type="text/javascript">
var dom = document.getElementById("container");
var myChart = echarts.init(dom);
var app = {};
var option;
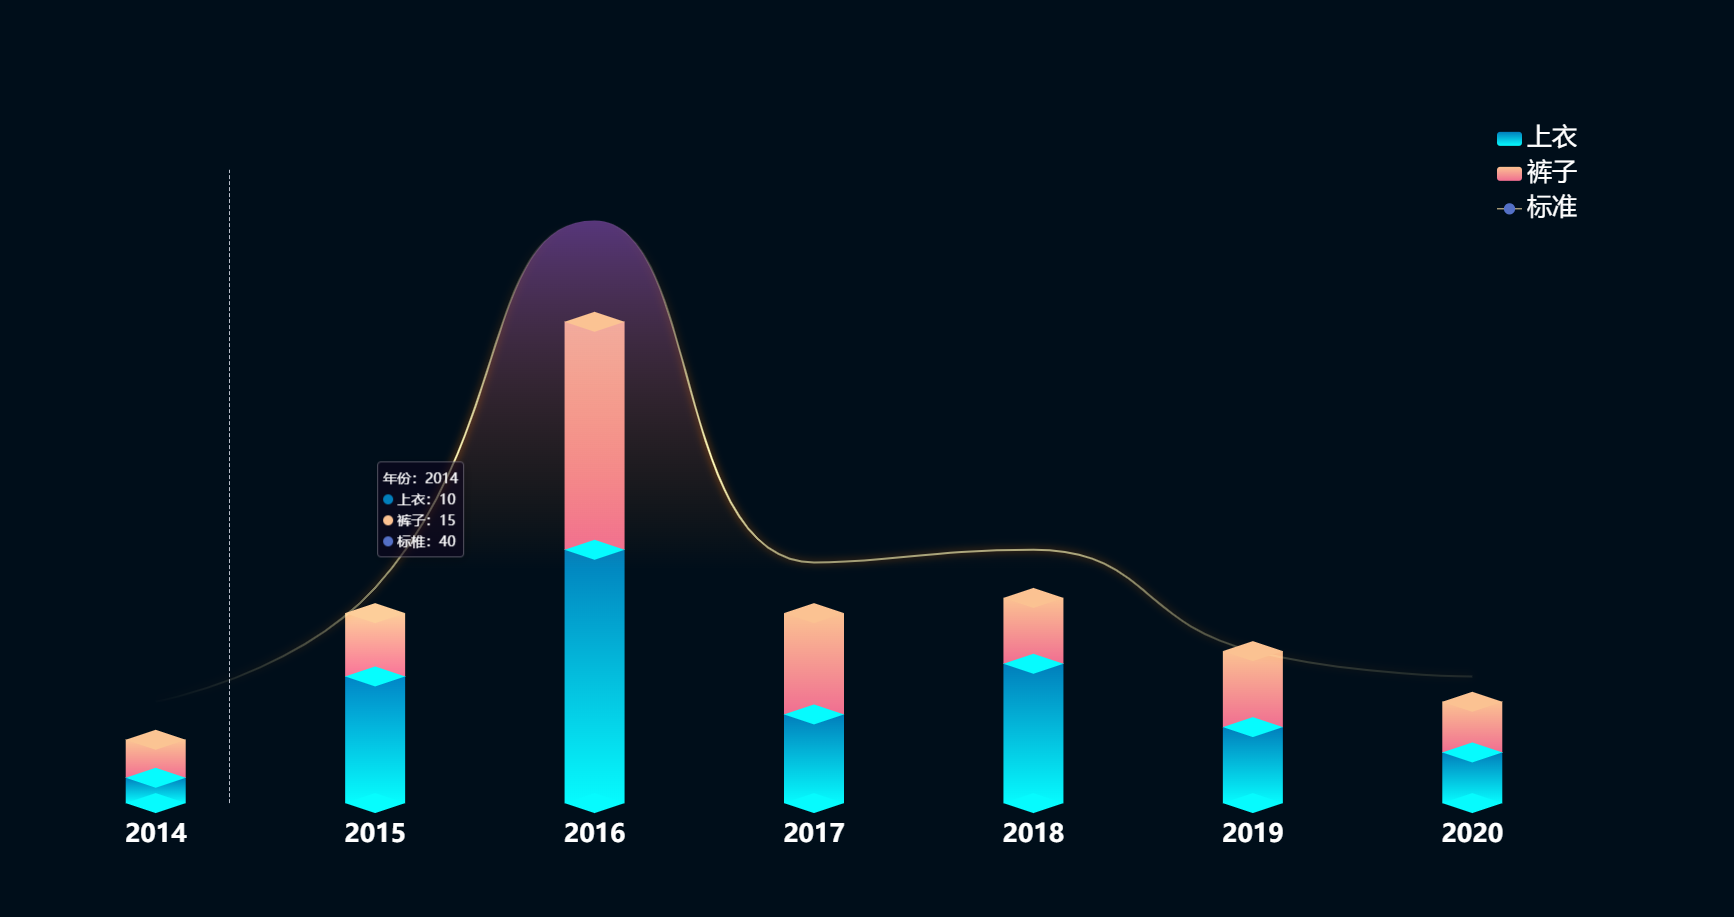
var xList = ['2014', '2015', '2016', '2017', '2018', '2019', '2020'];
var bottomList = [1, 1, 1, 1, 1, 1, 1];
var typeOneList = [10, 50, 100, 35, 55, 30, 20]; //上衣
var typeTwoList = [15, 25, 90, 40, 26, 30, 20]; //裤子
var standardValues = [40, 85, 230, 95, 100, 60, 50]; // 标准
var HighestList = [];
var topList = [];
for (let i = 0; i < typeOneList.length; i++) {
HighestList.push(typeOneList[i] + typeTwoList[i]);
}
for (let i = 0; i < typeOneList.length; i++) {
topList.push(typeOneList[i]);
}
option = {
backgroundColor: '#000E1A', //背景色
tooltip: {
trigger: 'axis',
borderColor: 'rgba(255,255,255,.3)',
backgroundColor: 'rgba(13,5,30,.6)',
textStyle: {
color: 'white', //设置文字颜色
},
borderWidth: 1,
padding: 5,
formatter: function (parms) {
var str =
'年份:' +
parms[0].axisValue +
'</br>' +
parms[0].marker +
'上衣:' +
parms[0].value +
'</br>' +
parms[1].marker +
'裤子:' +
parms[1].value +
'</br>' +
parms[2].marker +
'标椎:' +
parms[2].value;
return str;
},
},
textStyle: {
color: '#C9C9C9',
},
// color: ['#fbc292', '#06fbfe', '#f06e91'],
legend: {
type: 'scroll',
orient: 'vertical',
selectedMode: false, //图例点击失效
right: '10%',
top: '15%',
textStyle: {
color: '#ffffff',
fontSize: 25,
},
},
grid: {
containLabel: true,
left: '10%',
top: '20%',
bottom: '10%',
right: '10%',
},
xAxis: {
type: 'category',
data: xList,
axisLine: {
show: false,
lineStyle: {
color: '#B5B5B5',
},
},
axisTick: {
show: false,
},
axisLabel: {
margin: 20, //刻度标签与轴线之间的距离。
textStyle: {
fontFamily: 'Microsoft YaHei',
color: '#FFF',
},
fontSize: 25,
fontStyle: 'bold',
},
},
yAxis: [
{
type: 'value',
axisLine: {
show: false,
lineStyle: {
color: '#B5B5B5',
},
},
splitLine: {
show: false,
// lineStyle: {
// // 使用深浅的间隔色
// color: ["#B5B5B5"],
// type: "dashed",
// opacity: 0.5,
// },
},
axisLabel: {
show: false,
textStyle: {
fontFamily: 'Microsoft YaHei',
color: '#FFF',
},
fontSize: 20,
},
},
{
show: false,
type: 'value',
},
],
series: [
{
type: 'bar',
name: '上衣',
type: 'bar',
data: typeOneList,
stack: 'zs',
barMaxWidth: 'auto',
barWidth: 60,
itemStyle: {
color: {
x: 0,
y: 0,
x2: 0,
y2: 1,
type: 'linear',
global: false,
colorStops: [
{
offset: 0,
color: '#017ebb',
},
{
offset: 1,
color: '#06fbfe',
},
],
},
},
},
{
name: '裤子',
type: 'bar',
data: typeTwoList,
stack: 'zs',
type: 'bar',
barMaxWidth: 'auto',
barWidth: 60,
itemStyle: {
color: {
x: 0,
y: 0,
x2: 0,
y2: 1,
type: 'linear',
global: false,
colorStops: [
{
offset: 0,
color: '#fbc292',
},
{
offset: 1,
color: '#f06e91',
},
],
},
},
},
{
name: '标准',
type: 'line',
data: standardValues,
smooth: true,
symbol: 'none',
itemStyle: {
normal: {
lineStyle: {
color: new echarts.graphic.LinearGradient(0, 0, 0, 1, [
{
offset: 0,
color: 'rgba(255, 227, 168, 0)',
},
{
offset: 0.5,
color: 'rgba(255, 227, 168, 1)',
},
{
offset: 1,
color: 'rgba(255, 227, 168, 0)',
},
]),
shadowColor: 'rgba(255, 120, 0,1)',
shadowBlur: 8,
},
areaStyle: {
color: new echarts.graphic.LinearGradient(0, 0, 0, 1, [
{
offset: 0,
color: 'rgba(197, 106, 255, 0.6)',
},
{
offset: 0.6,
color: 'rgba(255, 120, 0, 0)',
},
]),
},
},
},
},
{
data: bottomList, // 最小面平面
type: 'pictorialBar',
barMaxWidth: '20',
symbol: 'diamond',
symbolOffset: [0, '50%'],
symbolSize: [60, 20],
zlevel: 2,
itemStyle: {
normal: {
color: '#06fbfe',
},
},
},
{
data: topList, // 第一个和第二个之间平面
type: 'pictorialBar',
barMaxWidth: '20',
symbolPosition: 'end',
symbol: 'diamond',
symbolOffset: [0, '-50%'],
symbolSize: [60, 20],
zlevel: 2,
itemStyle: {
normal: {
color: '#06fbfe',
},
},
},
{
data: HighestList, // 最上方平面
type: 'pictorialBar',
barMaxWidth: '20',
symbolPosition: 'end',
symbol: 'diamond',
symbolOffset: [0, '-50%'],
symbolSize: [60, 20],
zlevel: 2,
itemStyle: {
normal: {
color: '#fbc292',
},
},
},
],
};
if (option && typeof option === 'object') {
myChart.setOption(option);
}
</script>
</body>
</html>


 浙公网安备 33010602011771号