
Matplotlib笔记:添加网格与描述
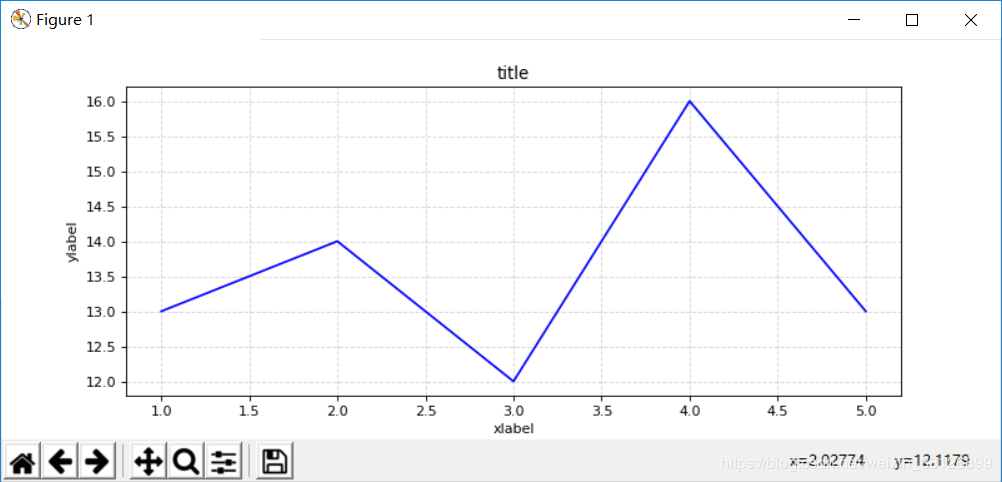
"""
    添加网格与猫叔
"""

import matplotlib.pyplot as plt

plt.figure(figsize=(10, 4), dpi=80)  # 图片长宽和清晰度
plt.plot([1, 2, 3, 4, 5], [13, 14, 12, 16, 13], "b")

plt.grid(True, linestyle="--", alpha=0.5)   # 网格
plt.title("title")
plt.xlabel("xlabel")
plt.ylabel("ylabel")

plt.show()

 浙公网安备 33010602011771号