

地震灾害易发性的决策树模型及决策树的可视化(Python实现)
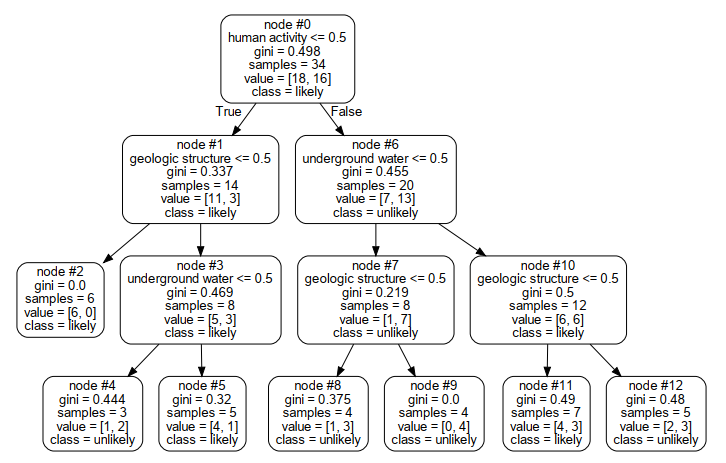
可视化决策树结果如下:
程序如下:
import numpy as np
import pandas as pd
import pydotplus
from sklearn.tree import DecisionTreeClassifier
from sklearn.tree import export_graphviz
from sklearn.preprocessing import  LabelEncoder
from sklearn.metrics import classification_report
df = pd.read_excel("susceptibility.xls",index_col=0)
df.head()
geologic = LabelEncoder()
df.iloc[:,0]=geologic.fit_transform(df.iloc[:,0])
print(np.array(df.iloc[:,0]))
geologic_label = geologic.classes_
print("geologic_label:    ",geologic_label)
human = LabelEncoder()
df.iloc[:,1]=human.fit_transform(df.iloc[:,1])
print(np.array(df.iloc[:,1]))
human_label = human.classes_
print("human_label:    ",human_label)
water = LabelEncoder()
df.iloc[:,2]=water.fit_transform(df.iloc[:,2])
print(np.array(df.iloc[:,2]))
water_label = water.classes_
print("water_label:    ",water_label)
susceptibility = LabelEncoder()
df.iloc[:,3]=susceptibility.fit_transform(df.iloc[:,3])
print(np.array(df.iloc[:,3]))
susceptibility_label = susceptibility.classes_
print("susceptibility_label:    ",susceptibility_label)
decision_tree = DecisionTreeClassifier().fit(df.iloc[:,:3],df.iloc[:,3])
decision_tree_predict = decision_tree.predict(df.iloc[:,:3])
print(classification_report(df.iloc[:,3],decision_tree_predict))
dot_data = export_graphviz(decision_tree,feature_names = df.columns[:3],class_names =susceptibility_label,
                         rounded = True,node_ids=True)
graph_data = pydotplus.graph_from_dot_data(dot_data)
graph_data.write_pdf("decision_tree_visulization.pdf")
该模型的训练精度如下:未划分训练集和测试集(故未测试精度):
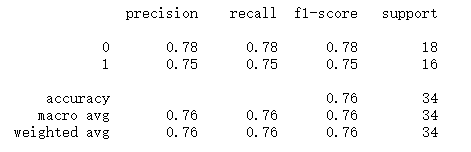
用决策树的训练精度为0.76
遇到的困难:
在可视化时,遇到不能导出PDF文件的问题,通过百度查看出错的解决办法,得到如下经验:
由于刚安装完graphviz程序,还需要注册插件,使用右击使用管理员来运行anaconda prompt程序 运行 dot -c 即可

 浙公网安备 33010602011771号