
ECharts使用
下载
https://echarts.baidu.com/
引入
<script src="/plugin/ECharts/echarts.js"></script>
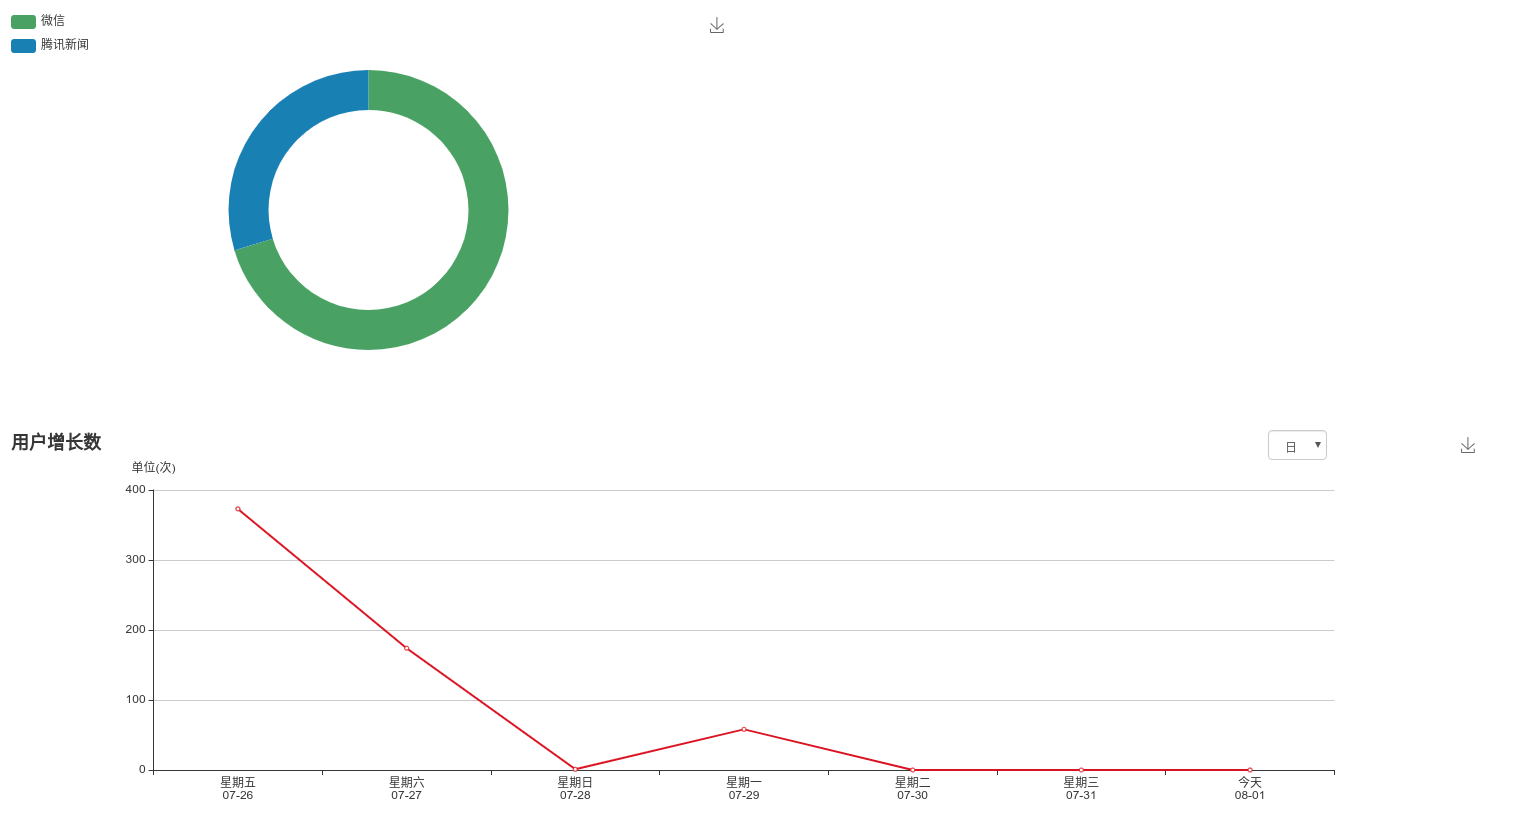
创建容器
<div class="row margin-beauty">
    <div class="col-md-6">
        <div id="user_from" style="width: 90%;height:400px;">
        </div>
    </div>
</div>

<div class="row margin-beauty">
    <div class="col-md-12">
        <div class="margin-bottom-beauty top-select">
            <select id="user-select" class="form-control-erbi">
                <option value="day">日</option>
                <option value="week">周</option>
                <option value="month">月</option>
            </select>
        </div>
        <div id="user_num" style="width: 90%;height:400px;">
        </div>
    </div>
</div>
创建对象和Option
<script type="text/javascript">
    ajaxGetUserFrom();
    function ajaxGetUserFrom() {
        let userFromChart = echarts.init(document.getElementById('user_from'));
        $.ajax({
            url: "ajaxGetUserFrom",
            data: {
            },
            type: "POST",
            dataType: "json",
            success: function (res) {
                let userFromOption = {
                    tooltip: {
                        trigger: 'item',
                        formatter: "{a} <br/>{b}: {c} ({d}%)"
                    },
                    toolbox: {
                        feature: {
                            saveAsImage: {}
                        }
                    },
                    legend: {
                        orient: 'vertical',
                        x: 'left',
                        data: ['微信', '腾讯新闻']
                    },
                    series: [
                        {
                            name: '用户来源',
                            type: 'pie',
                            radius: ['50%', '70%'],
                            avoidLabelOverlap: false,
                            label: {
                                normal: {
                                    show: false,
                                    position: 'center'
                                },
                                emphasis: {
                                    show: true,
                                    textStyle: {
                                        fontSize: '30',
                                        fontWeight: 'bold'
                                    }
                                }
                            },
                            labelLine: {
                                normal: {
                                    show: false
                                }
                            },
                            data: [
                                {
                                    value: res.data.wx_count,
                                    name: '微信',
                                    itemStyle: {
                                        color: '#52a360',
                                    }
                                },
                                {
                                    value: res.data.h5_count,
                                    name: '腾讯新闻',
                                    itemStyle: {
                                        color: '#2282b7',
                                    }
                                },
                            ]
                        }
                    ]
                };
                userFromChart.setOption(userFromOption);

            }
        });
    }


    $("#user-select").change(function () {
        let type = $(this).val();
        ajaxGetUserNum(type);
    });


    ajaxGetUserNum('day');
    function ajaxGetUserNum(type) {
        let userNumChart = echarts.init(document.getElementById('user_num'));
        $.ajax({
            url: "ajaxGetUserNum",
            data: {
                "type": type,
            },
            type: "POST",
            dataType: "json",
            success: function (res) {
                // 指定图表的配置项和数据
                let userNumOption = getLineOption('用户增长数', res.data.xAxis_data, res.data.series_data, '#d5070a');
                userNumChart.setOption(userNumOption);
            }
        });
    }


    /**
     * 获取折现图option
     * @param title
     * @param xAxis_data
     * @param series_data
     * @param color
     * @returns {{yAxis: {name: string, type: string}[], xAxis: {data: *, type: string}, lineStyle: {color: *}, series: {data: *, type: string}[], tooltip: {}, toolbox: {feature: {saveAsImage: {}}}, itemStyle: {color: *}, title: {text: *}}}
     */
    function getLineOption(title, xAxis_data, series_data, color) {
        let option = {
            title: {
                text: title
            },
            tooltip: {},
            xAxis: {
                type: 'category',
                data: xAxis_data,
            },
            yAxis: [
                {
                    name: '单位(次)',
                    type: 'value',
                }
            ],
            series: [{
                data: series_data,
                type: 'line'
            }],
            toolbox: {
                feature: {
                    saveAsImage: {}
                }
            },
            itemStyle: {
                color: color, //改变折线点的颜色
            },
            lineStyle: {
                color: color //改变折线颜色
            }
        };
        return option;
    }
</script>
获取数据
public function ajaxGetUserFrom() {
    $out_data = [];
    $user = M('user');
    $out_data['wx_count'] = $user->where(['type'=>1])->count();
    $out_data['h5_count'] = $user->where(['type'=>2])->count();
    $this->json->S($out_data);
}

/**
 * 异步获取用户
 */
public function ajaxGetUserNum() {
    $out_data = [];
    $type = $_POST['type'];
    $user = M('user');
    switch ($type) {
        case 'day':
            // 获取最近七天的浏览量
            $week_array = DateHelper::getSevenDay();
            foreach ($week_array as $k=>$v) {
                $week_name = $v === date('Y-m-d') ? '今天' :DateHelper::getWeekByDate($v);
                $simple_date = DateHelper::simpleDate($v);
                $out_data['xAxis_data'][$k] = $week_name."\n".$simple_date;
                $out_data['series_data'][$k] = $user->where(['create_time'=>['between',[strtotime($v),strtotime($v.' 23:59')]]])->count();
            }
            break;
        case 'week':
            // 获取最近七周的浏览量
            $last_seven = DateHelper::getLastSevenWeek();
            foreach ($last_seven as $k=>$v) {
                $out_data['xAxis_data'][$k] = '第'.$v['week']."周\n".$v['begin_simple']."\n".$v['end_simple'];
                $out_data['series_data'][$k] = $user->where(['create_time'=>['between',[strtotime($v['begin_date']),strtotime($v['end_date'].' 23:59')]]])->count();
            }
            break;
        case 'month':
            // 获取最近七月的浏览量
            $last_seven = DateHelper::getLastSevenMonth();
            foreach ($last_seven as $k=>$v) {
                $out_data['xAxis_data'][$k] = $v['month']."月\n".$v['begin_simple']."\n".$v['end_simple'];
                $out_data['series_data'][$k] = $user->where(['create_time'=>['between',[strtotime($v['begin_date']),strtotime($v['end_date'].' 23:59')]]])->count();
            }
            break;
    }

    $this->json->S($out_data);
}

 浙公网安备 33010602011771号