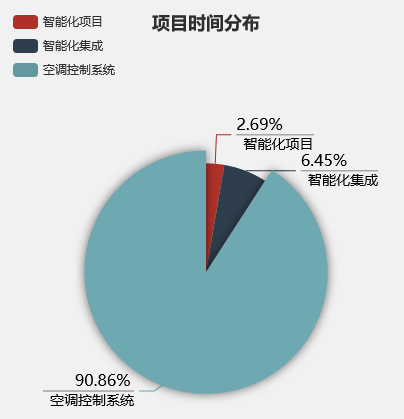
echarts 各种特效图
饼图标签展示数值
配置项:


option = {
    title: {
        text: '项目时间分布',
        left: 'center'
    },
    tooltip: {
        trigger: 'item',
        formatter: '{a} <br/>{b} : {c} ({d}%)'
    },
    legend: {
        orient: 'vertical',
        left: 'left',
        data: ['智能化项目', '智能化集成', '空调控制系统']
    },
    series: [
        {
            name: '访问来源',
            type: 'pie',
            radius: '55%',
            center: ['50%', '60%'],
                    label: {
            normal: {
                formatter: "{per|{d}%} \n{hr|}\n  {b|{b}}",
                align: "right",
                rich: {
                    hr: {
                        borderColor: "#aaa",
                        width: "100%",
                        borderWidth: 1,
                        height: 0
                    },
                    b: {
                        fontSize: 14,
                        color: "#000",
                        lineHeight: 20
                    },
                    per: {
                        color: "#000",
                        fontSize: 16,
                        lineHeight: 20
                    }
                }
            }
        },
            data: [
                {value: 5, name: '智能化项目'},
                {value: 12, name: '智能化集成'},
                {value: 169, name: '空调控制系统'},
            ],
            emphasis: {
                itemStyle: {
                    shadowBlur: 10,
                    shadowOffsetX: 0,
                    shadowColor: 'rgba(0, 0, 0, 0.5)'
                }
            }
        }
    ]
};
运行效果:
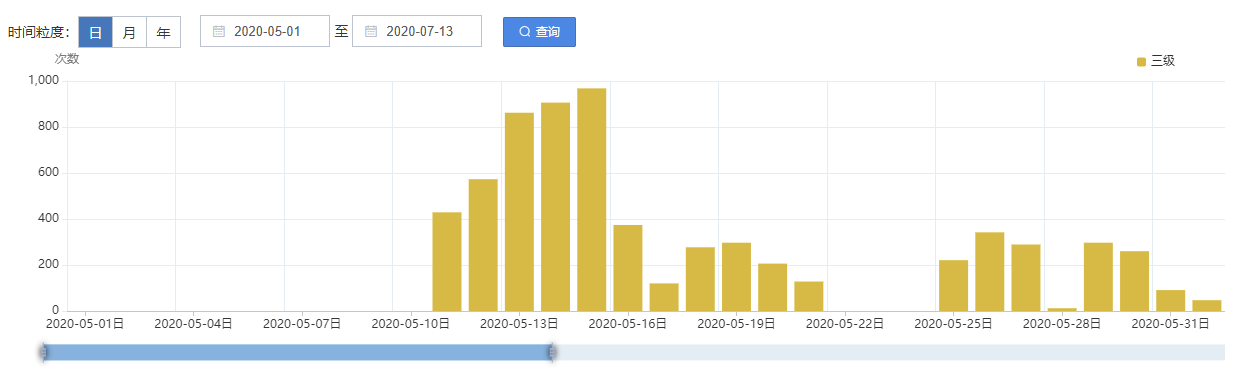
坐标轴显示箭头,刻度标签超出显示省略号
配置项:
const alarmRankOptions = {
    color: ['rgba(184,114,58,1)'], //['#A96932'],
    tooltip: {
        trigger: 'axis',
        axisPointer: {
            // 坐标轴指示器,坐标轴触发有效
            type: 'shadow' // 默认为直线,可选为:'line' | 'shadow'
        }
    },
    grid: {
        left: '3%',
        right: '4%',
        bottom: '0',
        containLabel: true,
        borderColor: 'red'
    },
    xAxis: [
        {
            type: 'category',
            data: [],
            axisTick: {
                alignWithLabel: true
            },
            // nameLocation:'end',//坐标轴名称显示位置。
            // x轴的字体样式
            axisLabel: {
                show: true,
                textStyle: {
                    color: '#E6EFFF'
                },
                interval: 0 //横轴信息全部显示
            },
            // x轴的颜色和宽度
            axisLine: {
                lineStyle: {
                    color: '#3C6581',
                    width: 1 //这里是坐标轴的宽度,可以去掉
                }
            }
        }
    ],
    yAxis: [
        {
            minInterval: 1,
            type: 'value',
            name: '数量:个',
            nameTextStyle: {
                color: '#E6EFFF'
            },
            axisLabel: {
                show: true,
                textStyle: {
                    color: '#E6EFFF'
                }
            },
            // y轴的颜色和宽度
            axisLine: {
                show: true,
                lineStyle: {
                    color: '#3C6581',
                    width: 1 //这里是坐标轴的宽度
                },
                symbol: ['none', 'arrow'],
                symbolSize: [6, 10] //第一个数字表示宽度(垂直坐标轴方向),第二个数字表示高度(平行坐标轴方向)。
            },
            //背景网格线
            splitLine: {
                show: false,
                lineStyle: {
                    // 使用深浅的间隔色
                    color: '#ccc',
                    type: 'dashed',
                    shadowBlur: 10
                }
            }
        }
    ],
    series: [
        {
            name: '待解决报警数',
            type: 'bar',
            barWidth: '20',
            label: {
                normal: {
                    show: true,
                    position: 'top' //'inside'
                }
            },
            data: [10, 52, 200, 334, 390, 330, 220, 40]
        }
    ]
};

export { alarmRankOptions };
运行结果:

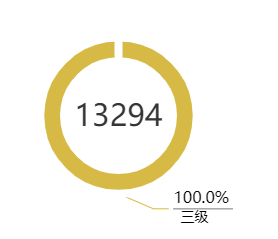
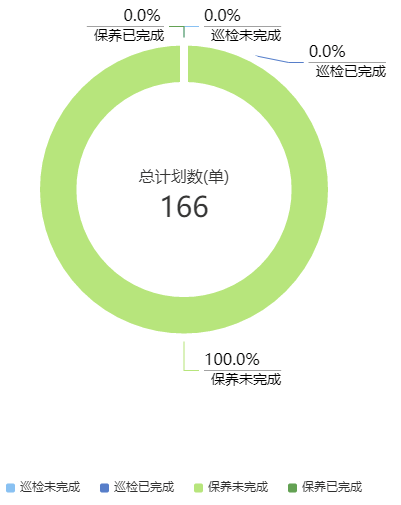
环形图标签显示值
配置项:
export const PieOption = {
    grid: {
        left: 50,
        right: 0,
        top: 0,
        containLabel: true,
        zlevel: 99999
    },
    tooltip: {
        trigger: "item",
        formatter: "{b}: {c}次 ({d}%)"
    },
    color: ["#ee6e6d", "#f19469", "#e7bf5f", "#74b8dd", "#67cb82"],
    title: {
        text: 0,
        textStyle: {
            color: "#3A3A3A",
            fontSize: 30,
            fontWeight: "normal"
        },
        subtext: "",
        subtextStyle: {
            color: "#3A3A3A",
            fontSize: 14
        },
        x: "center",

        y: "49%"
        // y: "46%"
    },
    series: [
        {
            name: "",
            type: "pie",
            // minAngle: 5,              //最小的扇区角度(0 ~ 360),用于防止某个值过小导致扇区太小影响交互
            avoidLabelOverlap: true, //是否启用防止标签重叠策略
            // radius: ["37%", "55%"],
            radius: ["32%", "46%"],
            center: ["50%", "54%"],
            // center: ["50%", "60%"],
            // radius: ["50%", "50%"],
            itemStyle: {
                borderColor: "rgba(255,255,255,1)",
                borderWidth: 8
            },
            label: {
                normal: {
                    formatter: "{per|{d}%} \n{hr|}\n  {b|{b}}",
                    align: "right",
                    rich: {
                        hr: {
                            borderColor: "#aaa",
                            width: "100%",
                            borderWidth: 1,
                            height: 0
                        },
                        b: {
                            fontSize: 14,
                            color: "#000",
                            lineHeight: 20
                        },
                        per: {
                            color: "#000",
                            fontSize: 16,
                            lineHeight: 20
                        }
                    }
                }
            },
            labelLine: {},
            data: [
                {
                    value: 150,
                    name: "一级告警"
                    // itemStyle: {
                    //     color: '#ee6e6d'
                    // }
                },
                {
                    value: 50,
                    name: "二级告警"
                    // itemStyle: {
                    //     color: '#f19469'
                    // }
                },
                {
                    value: 300,
                    name: "三级告警"
                    // itemStyle: {
                    //     color: '#e7bf5f'
                    // }
                },
                {
                    value: 500,
                    name: "四级告警"
                    // itemStyle: {
                    //     color: '#74b8dd'
                    // }
                },
                {
                    value: 350,
                    name: "五级告警"
                    // itemStyle: {
                    //     color: '#67cb82'
                    // }
                }
            ]
        }
    ]
};
运行结果:
柱状图水平滚动条
配置项:
export const BarOption = {
    color: ["#F1726b", "#f58e6b", "#e7c156", "#73b9dd", "#65ca84"],
    tooltip: {
        trigger: "axis",
        axisPointer: {
            // 坐标轴指示器,坐标轴触发有效
            type: "shadow" // 默认为直线,可选为:'line' | 'shadow'
        }
    },
    dataZoom: ConstDataZoom,
    legend: {
        data: ["一级", "二级", "三级", "四级", "五级"],
        itemWidth: 9,
        itemHeight: 9,
        itemGap: 20,
        right: 45
    },
    grid: {
        left: 50,
        right: 0,
        top: 30,
        containLabel: true
    },
    xAxis: [
        {
            type: "category",
            silent: false,
            data: [
                "1月",
                "2月",
                "3月",
                "4月",
                "5月",
                "6月",
                "7月",
                "8月",
                "9月",
                "10月",
                "11月",
                "12月"
            ],
            axisTick: {
                alignWithLabel: true
            },
            splitLine: {
                show: true,
                lineStyle: {
                    // 网格颜色
                    color: ["#E5EFF5"]
                }
            },
            axisLine: {
                lineStyle: {
                    color: "#ccc"
                }
            },
            axisLabel: {
                color: "#3A3A3A",
                interval: "auto"
            },
            splitArea: {
                show: false
            }
        }
    ],
    yAxis: [
        {
            type: "value",
            name: "次数",
            minInterval: 1, //设置成1保证坐标轴分割刻度显示成整数。
            nameTextStyle: {
                color: "#838383"
            },
            splitLine: {
                show: true,
                lineStyle: {
                    // 网格颜色
                    color: ["#E5EFF5"]
                }
            },
            axisLine: {
                lineStyle: {
                    color: "#E5EFF5"
                }
            },
            axisLabel: {
                color: "#3A3A3A",
                interval: 0
            }
        }
    ],
    series: [
        {
            name: "一级",
            type: "bar",
            data: [320, 332, 301, 334, 390, 320, 332, 301, 334, 390]
        },
        {
            name: "二级",
            type: "bar",
            data: [220, 182, 191, 234, 290, 220, 182, 191, 234, 290]
        },
        {
            name: "三级",
            type: "bar",
            data: [150, 232, 201, 154, 190, 150, 232, 201, 154, 190]
        },
        {
            name: "四级",
            type: "bar",
            data: [220, 182, 191, 234, 290, 220, 182, 191, 234, 290]
        },
        {
            name: "五级",
            barGap: 0,
            type: "bar",
            data: [220, 182, 191, 234, 290, 220, 182, 191, 234, 290]
        }
    ]
};
运行结果:
tooltip.formatter保留默认图标
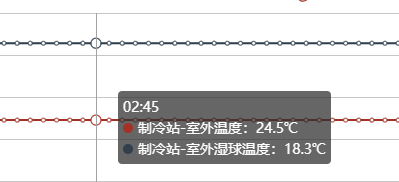
 //tooltip start
      option.tooltip.formatter = function(param) {
        // console.log("param :>> ", param);
        let str = param.length > 0 ? `${param[0].name}<br/>` : "";
        param.forEach((item, idx) => {
          str +=
            renderSpan(item.color) +
            item.seriesName +
            ":" +
            item.value +
            units[idx] +
            "<br/>";
        });
        return str;
      };
      function renderSpan(color) {
        return `<span style="display:inline-block;margin-right:5px;border-radius:10px;width:10px;height:10px;background-color:${color};"></span>`;
      }
      //tooltip end
.............
| 博客地址: | http://www.cnblogs.com/jiekzou/ | |
| 博客版权: | 本文以学习、研究和分享为主,欢迎转载,但必须在文章页面明显位置给出原文连接。 如果文中有不妥或者错误的地方还望高手的你指出,以免误人子弟。如果觉得本文对你有所帮助不如【推荐】一下!如果你有更好的建议,不如留言一起讨论,共同进步! 再次感谢您耐心的读完本篇文章。 |
|
| 其它: |
.net-QQ群4:612347965
java-QQ群:805741535
H5-QQ群:773766020 |


 浙公网安备 33010602011771号