python 聚类分析 k均值算法
dataSet = [          #数据集
    # 1
    [0.697, 0.460],
    # 2
    [0.774, 0.376],
    # 3
    [0.634, 0.264],
    # 4
    [0.608, 0.318],
    # 5
    [0.556, 0.215],
    # 6
    [0.403, 0.237],
    # 7
    [0.481, 0.149],
    # 8
    [0.437, 0.211],
    # 9
    [0.666, 0.091],
    # 10
    [0.243, 0.267],
    # 11
    [0.245, 0.057],
    # 12
    [0.343, 0.099],
    # 13
    [0.639, 0.161],
    # 14
    [0.657, 0.198],
    # 15
    [0.360, 0.370],
    # 16
    [0.593, 0.042],
    # 17
    [0.719, 0.103],
    # 18
    [0.359, 0.188],
    # 19
    [0.339, 0.241],
    # 20
    [0.282, 0.257],
    # 21
    [0.748, 0.232],
    # 22
    [0.714, 0.346],
    # 23
    [0.483, 0.312],
    # 24
    [0.478, 0.437],
    # 25
    [0.525, 0.369],
    # 26
    [0.751, 0.489],
    # 27
    [0.532, 0.472],
    # 28
    [0.473, 0.376],
    # 29
    [0.725, 0.445],
    # 30
    [0.446, 0.459]
    ]
# print(len(dataSet))
# print(dataSet)

# '''
m = len(dataSet)           #存储dataSet的长度
# print(m)
k = int(input("请输入簇数:"))
miu = []                   #用于存储均值向量
choice = sample(list(range(m)),k)  #从列表中随机抽样k个元素
miu = [dataSet[i] for i in choice] #初始化均值向量
# print("μ:\n{}".format(miu))

times = 0
while True:
    times = times+1
    if times>100:
        print("循环次数过多")
        break
    a = [[] for i in range(k)]  # 用于存储样本与各均值向量的距离
    # print(a)
    for j in range(m):          # 计算xj与各均值向量μi的距离
        bar = 1000000000000000000000   #聚类比较值
        biaoji = -1             # 簇标记
        for i in range(k):
            dis = np.hypot(dataSet[j][0]-miu[i][0],dataSet[j][1]-miu[i][1])
            if dis<bar:
                bar = dis; biaoji = i
        a[biaoji].append(dataSet[j])  #根据距离最近的均值向量确定xj的簇标记
    # print("簇0\n{}".format(a[0]))
    # print("簇1\n{}".format(a[1]))
    # print("簇2\n{}".format(a[2]))

    miu1 = [[] for i in range(k)]     #重新计算均值向量
    for i in range(k):
        miu1[i].append(np.sum([a[i][j][0] for j in range(len(a[i]))])/len(a[i]))
        miu1[i].append(np.sum([a[i][j][1] for j in range(len(a[i]))])/len(a[i]))
    if miu==miu1: #如果前后均值向量相等,跳出
        break
    else:
        miu = miu1
    # break

print("循环次数:\n{}".format(times))
print("簇0\n{}".format(a[0]))
print("簇1\n{}".format(a[1]))
print("簇2\n{}".format(a[2]))
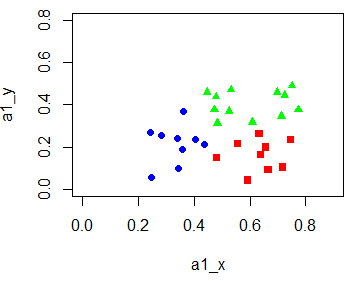
其中得到的一组结果:
x1 = [[0.634, 0.264], [0.556, 0.215], [0.481, 0.149], [0.666, 0.091], [0.639, 0.161], [0.657, 0.198], [0.593, 0.042], [0.719, 0.103], [0.748, 0.232]]

x2 = [[0.403, 0.237], [0.437, 0.211], [0.243, 0.267], [0.245, 0.057], [0.343, 0.099], [0.36, 0.37], [0.359, 0.188], [0.339, 0.241], [0.282, 0.257]]

x3 = [[0.697, 0.46], [0.774, 0.376], [0.608, 0.318], [0.714, 0.346], [0.483, 0.312], [0.478, 0.437], [0.525, 0.369], [0.751, 0.489], [0.532, 0.472], [0.473, 0.376], [0.725, 0.445], [0.446, 0.459]]
[0.46, 0.376, 0.318, 0.346, 0.437, 0.369, 0.489, 0.472, 0.376, 0.445, 0.459]
用R作图:
a1_x = c(0.634, 0.556, 0.481, 0.666, 0.639, 0.657, 0.593, 0.719, 0.748)
a1_y = c(0.264, 0.215, 0.149, 0.091, 0.161, 0.198, 0.042, 0.103, 0.232)
a2_x = c(0.403, 0.437, 0.243, 0.245, 0.343, 0.36, 0.359, 0.339, 0.282)
a2_y = c(0.237, 0.211, 0.267, 0.057, 0.099, 0.37, 0.188, 0.241, 0.257)
a3_x = c(0.697, 0.774, 0.608, 0.714, 0.483, 0.478, 0.525, 0.751, 0.532, 0.473, 0.725, 0.446)
a3_y = c(0.46, 0.376, 0.318, 0.346, 0.312, 0.437, 0.369, 0.489, 0.472, 0.376, 0.445, 0.459)

plot(a1_x,a1_y,pch = 15,xlim = c(0,0.9),ylim = c(0,0.8),col = "red")
points(a2_x,a2_y,pch = 16,col = "blue")
points(a3_x,a3_y,pch = 17,col = "green")
#老师的代码,时间复杂度很低:
'''
1.对簇中心进行循环
2.利用numpy包的函数进行运算
'''
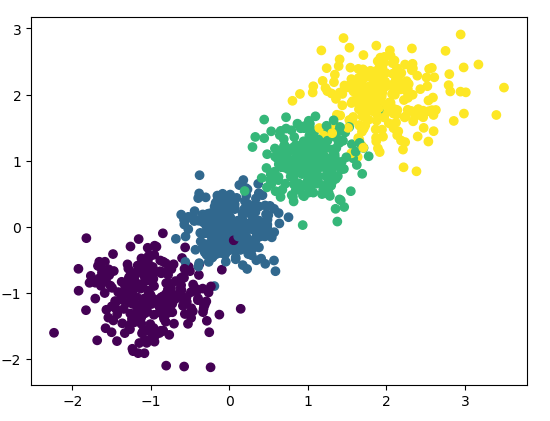
from sklearn.datasets.samples_generator import make_blobs
import numpy as np
import matplotlib.pyplot as plt
#生成数据
X,y = make_blobs(n_samples=1000,n_features=2,centers=[[-1,-1],[0,0],[1,1],[2,2]],cluster_std=[0.4,0.3,0.3,0.4],random_state=7)
plt.scatter(X[:,0],X[:,1],c = y)
plt.show()
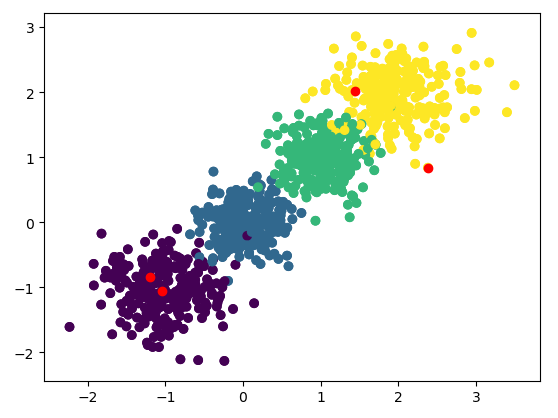
#k-means聚类
n_cluster = 4 #聚类簇数
n = len(X)    #散点个数
dist = np.zeros((n,n_cluster)) #存放各点到簇中心点的距离
sample_index = np.arange(n)
cluster_center = X[np.random.choice(sample_index,n_cluster),:] #随机选取簇中心点
new_cluster_center = np.zeros((n_cluster,2)) #存放簇中心坐标
plt.scatter(X[:,0],X[:,1],c=y)
plt.scatter(cluster_center[:,0],cluster_center[:,1],c = 'red')
plt.show()
ISok = False
time = 0
while not ISok:
    time = time + 1
    if time>100:
        break
    #计算每个点到簇中心的距离
    for i in range(n_cluster):
        # dist[:,i] = np.sqrt(np.sum((X - cluster_center[i,:])**2,axis=1)) #存储各点到簇中心的距离
        dist[:, i] = np.hypot(X[:, 0] - cluster_center[i, 0], X[:, 1] - cluster_center[i, 1])
    #将数据点放进与其最近的簇
    ClassID = np.argmin(dist,axis=1) #存储与数据点最近的簇中心编号
    #计算新的簇中心
    for i in range(n_cluster):
        Classmask = (ClassID == i)   #提取每个数据点的布尔值,也就是这个点属于第i簇布尔值为True
        new_cluster_center[i,:] = np.average(X[Classmask,:],axis = 0) #计算新的簇中心
    e = np.sum(np.sqrt(np.sum((new_cluster_center - cluster_center) ** 2, axis=1)))
    # print(e)
    if e < 1e-6 :
        ISok = True
    else:
        cluster_center = new_cluster_center
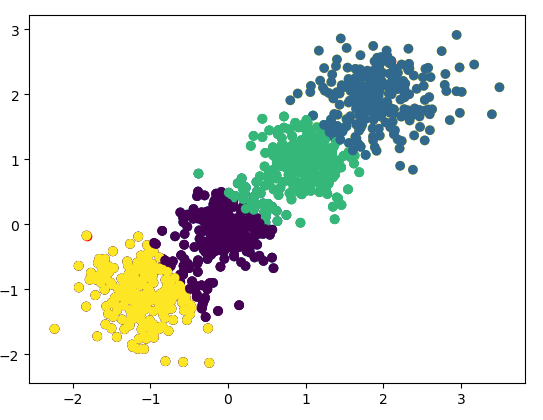
print("运行了{}次".format(time))
plt.scatter(X[:,0],X[:,1],c = ClassID)
plt.show()

 浙公网安备 33010602011771号