R 《回归分析与线性统计模型》page120,4.3
#P120习题4.3
rm(list = ls())
A = read.xlsx("xiti_4.xlsx",sheet = 3)
names(A) = c("ord","Y","K","L")
attach(A)
fm = lm(Y~log(K)+log(L))#线性回归模型
ei = resid(fm)
X = cbind(1,as.matrix(A[,3:4]))
t = ti(ei,X)   #外部学生化残差
plot(fitted(fm),t) #绘制残差图
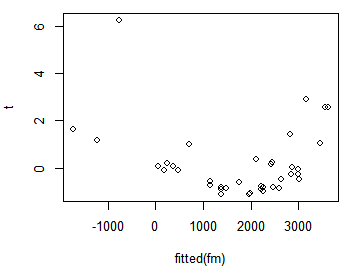
从残差图中看出来,方差不齐
a1 = boxcox(fm,lambda = seq(0,1,by=0.1))

从图像中看出,λ可取0,即进行对数变换
#进行对数变换
lm.log = lm(log(Y)~log(L)+log(K))
coef(lm.log)

summary(lm.log)
detach(A)
> summary(lm.log)

Call:
lm(formula = log(Y) ~ log(L) + log(K))

Residuals:
    Min      1Q  Median      3Q     Max
-1.7251 -0.1764 -0.0059  0.1707  1.3035

Coefficients:
            Estimate Std. Error t value Pr(>|t|)
(Intercept)  0.38004    0.26873   1.414    0.166
log(L)       0.05699    0.04471   1.275    0.211
log(K)       0.93065    0.04131  22.526   <2e-16 ***
---
Signif. codes:
0 ‘***’ 0.001 ‘**’ 0.01 ‘*’ 0.05 ‘.’ 0.1 ‘ ’ 1

Residual standard error: 0.441 on 35 degrees of freedom
Multiple R-squared:  0.944,	Adjusted R-squared:  0.9408
F-statistic:   295 on 2 and 35 DF,  p-value: < 2.2e-16

 浙公网安备 33010602011771号