
基于豆瓣虫数据的四大名著发展现状及内容简析
基于豆瓣虫数据的四大名著发展现状及内容简析
一,选题的背景
四大名著承载了许多文化精华,在潜移默化中对许多人的思维智慧、为人处世方式产生了影响,对往后社会思潮、社会风气、政治生态变化有着深远影响。从社会方面:中国的四大名著是《三国演义》《水浒传》《西游记》《红楼梦》。这四部著作历久不衰,是汉语文学史中不可多得的经典作品。其中的故事场景、人物已经深深地影响了中国人的思想观念、价值取向。四部著作都有很高的文学水平和艺术成就。细致的刻画和所蕴含的深刻思想都为历代读者所称道。是中国文学史上的四座伟大丰碑。
预期目标:爬取豆瓣数据的四大名著发展现状及内容简析
二,网络爬虫设计方案
1,网络爬虫名称:爬取豆瓣数据的四大名著发展现状及内容简析。
2,爬虫爬取的内容与数据特征分析:主要内容为四大名著的章节节选并保存为txt文本进行数据内容解析。
三,结构特征分析
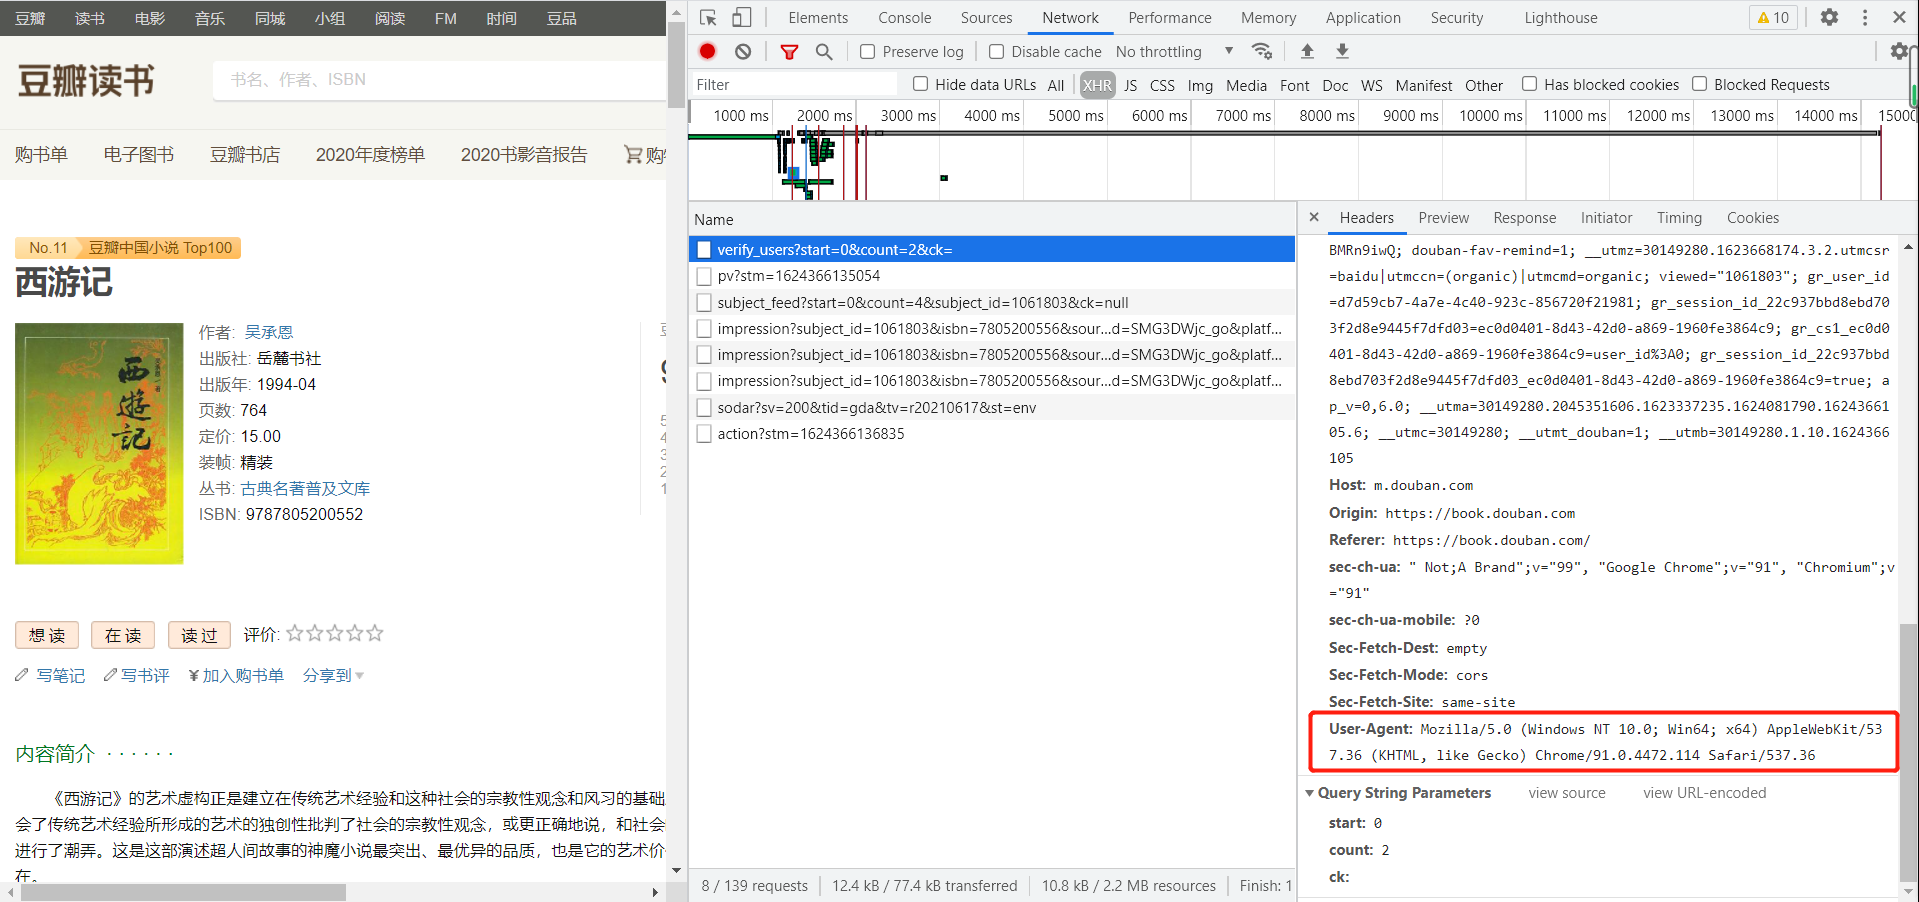
1,页面的结构与特征分析
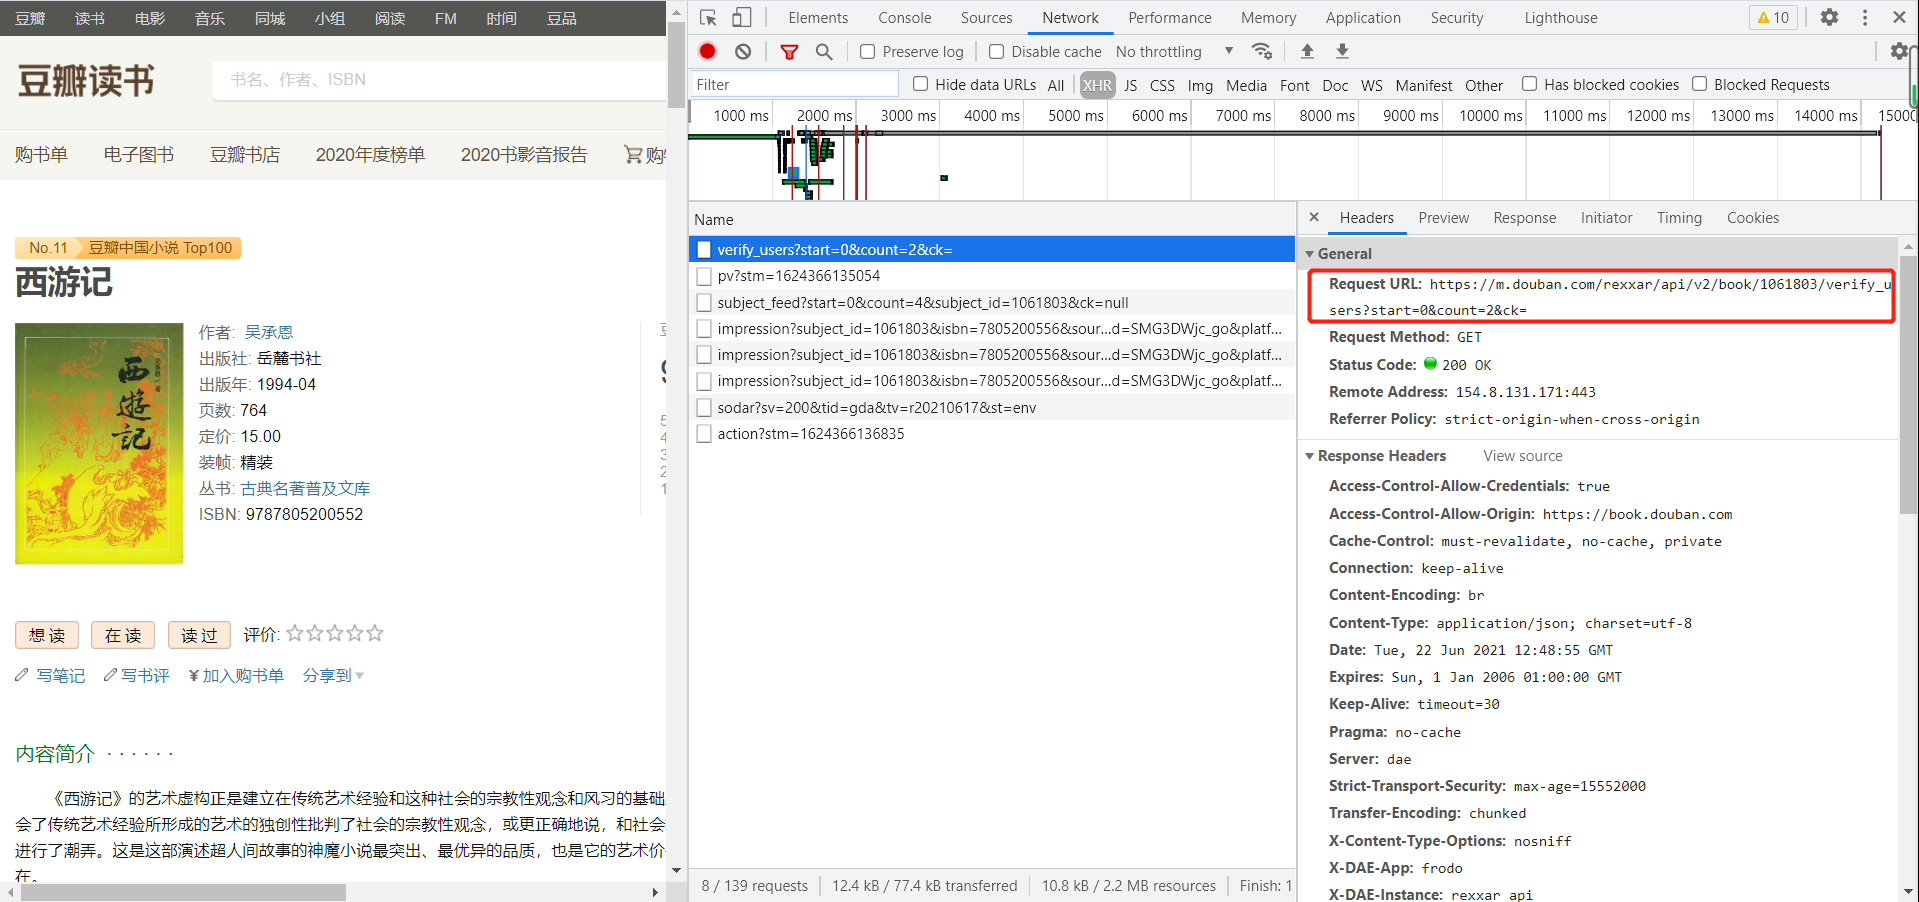
按f12获取url地址,与反爬代码。
四,爬虫程序设计
1,数据爬取与采集
#定义爬取豆瓣网信息函数
  1 #定义爬取豆瓣网信息函数
  2 import requests
  3 from bs4 import BeautifulSoup
  4
  5 def parse_html(book):
  6     headers = {
  7         'User-Agent': 'Mozilla/5.0 (Windows NT 6.1; Win64; x64) AppleWebKit/537.36 (KHTML, like Gecko) Chrome/58.0.3029.110 Safari/537.36'
  8     }
  9     response = requests.get(f'https://www.douban.com/search?q=' + book ,headers=headers)
 10     #response = requests.get(f'https://book.douban.com/top250?start={num}', headers=headers)
 11     soup = BeautifulSoup(response.text, 'lxml')
 12     #print(soup)
 13
 14     #类型和名称
 15     all_Type = soup.find_all('h3')
 16     book_names = [Type.get_text() for Type in all_Type]
 17     leixing = []
 18     mingcheng = []
 19     for piece in book_names:
 20         if "小组" in piece:
 21             continue
 22         elif "日记" in piece:
 23             continue
 24         else:  #首先去除爬取到的多余信息
 25             piece  = piece.strip().replace(' ', '')
 26             piece = piece.strip().replace('[', '')
 27             piece = piece.strip().replace('可播放', '')
 28             piece = piece.strip().replace('可试读', '')
 29             piece = piece.strip().replace('有电子版', '')
 30             piece = piece.strip().replace('\n', '')
 31             piece = piece.strip().replace('\xa0', '')
 32             str1 = piece.split(']')
 33             if book in str1[0]:
 34                 continue
 35             else:
 36                 leixing.append(str1[0])
 37                 mingcheng.append(str1[1])
 38             #for i in str1:
 39                # print(i)
 40     #print(len(leixing))
 41     #print(mingcheng)
 42
 43
 44     #出版年份ok
 45     all_year = soup.find_all('span', class_='subject-cast')
 46     nianfen = []
 47     book_years = [year.get_text() for year in all_year]
 48     for piece in book_years:
 49         str1 = piece.split(' ')
 50         try:
 51             nianfen.append(int(str1[-1]))  #在获得数据中摘取出版年份
 52         except:    #抛出异常,排除没有出版年份(即对应位置数据不能转换成int型数据)的情况
 53             nianfen.append(0)
 54     #print(len(nianfen))
 55
 56
 57     #评价人数ok
 58     all_people = soup.find_all('span',class_='')
 59     book_people = [people.get_text() for people in all_people]
 60     renshu = []
 61     i=0
 62     for piece in book_people:
 63         if '[' not in piece:
 64             i +=1
 65         else:
 66             break
 67     book_people = book_people[i::]    #摘除开头多余的信息
 68
 69     for piece in book_people:
 70         if '日记' in piece:
 71             continue
 72         elif '小组' in piece:
 73             continue
 74             #print(piece)
 75         elif '人评价' in piece:   #摘取含有评价人数的元素
 76             piece = piece.strip('(').strip(')')
 77             piece = piece.strip("人评价")   #去除字符串中多余指定字符
 78             renshu.append(int(piece))
 79         elif "(" in piece:  #对于“暂未上映”或者“尚无评价”的数据,将评价人数赋为0
 80             renshu.append(0)
 81         #else:
 82             #renshu.append(0)
 83     #print(type(book_people))
 84     #print(len(renshu))
 85     #print(renshu)
 86
 87     #评分ok
 88     all_mark = soup.find_all('span', class_='rating_nums')
 89     book_rates = [mark.get_text() for mark in all_mark]
 90     #print(len(book_rates))
 91     pingfen = []
 92     for i in range(len(mingcheng)):  #不能用len(book_rates),某些无评分的数据未导入,book_rates长度比其他列表短,会造成信息错乱
 93         if renshu[i] ==0:
 94             pingfen.append(float(0))  #对于无评分的数据将评分补成0
 95             book_rates.insert(i,'0')  #
 96         else:
 97             pingfen.append(float(book_rates[i]))
 98     #print(len(pingfen))
 99     #print(len(mingcheng))
100     #print(pingfen)
101
102     content = []
103     content = [leixing, mingcheng, nianfen, renshu, pingfen]
104     return content
105
#为方便观察爬取到的结果,将数据写入csv文件,定义写入格式
 1 import csv
 2 import pandas as pd
 3 #csv 写入
 4
 5 def write_(book,content):
 6     #Type.append('type')
 7     #Name.append('name')
 8     content[0].insert(0,"类型")
 9     content[1].insert(0,"名称")
10     content[2].insert(0,"出版年份")
11     content[3].insert(0,"评价人数")
12     content[4].insert(0,"评分")
13     file1= open(book + '.csv','a+', newline='')
14     #a+:打开一个文件用于读写。如果该文件已存在,文件指针将会放在文件的结尾。文件打开时会是追加模式。如果该文件不存在,创建新文件用于读写。
15     #设定写入模式
16     csv_write = csv.writer(file1,dialect='excel')
17     #写入具体内容
18     #dataframe1 = pd.DataFrame({'Type':Type,'Name':Name})
19
20     for val in zip(content[0],content[1],content[2],content[3],content[4]):
21         csv_write.writerow(val)
22     #csv_write.writerow(Type)
23     #csv_write.writerow(Name)
24     file1.close()
25     print ("write over")
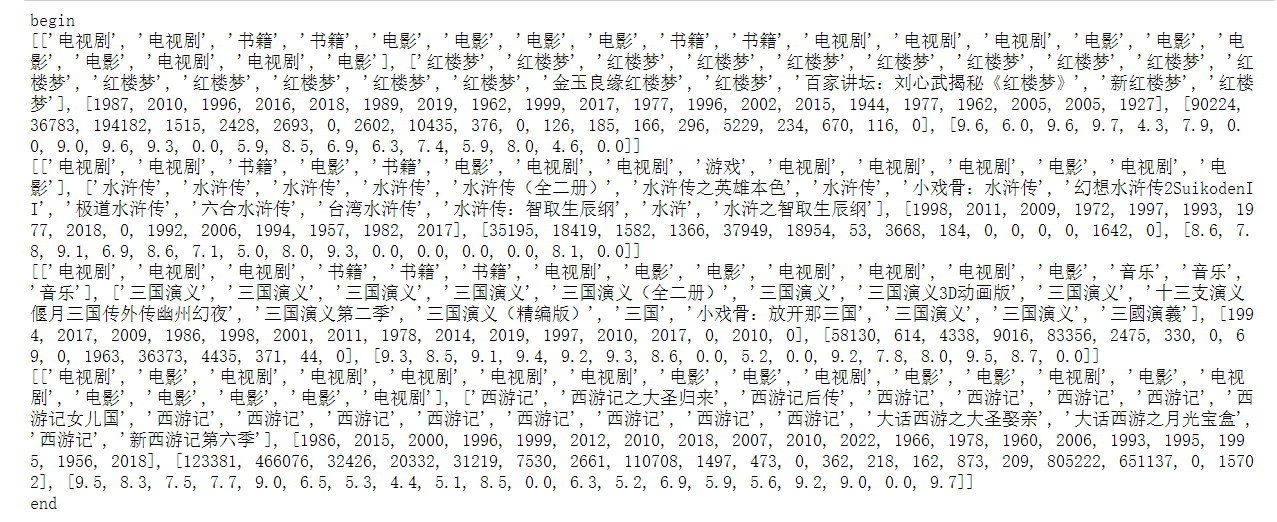
#从豆瓣网上爬取四大名著相关产品的数据
 1 #从豆瓣网上爬取四大名著相关产品的数据
 2 if __name__ == '__main__':
 3     print('begin')
 4     data1 = parse_html("红楼梦")
 5     data2 = parse_html("水浒传")
 6     data3 = parse_html("三国演义")
 7     data4 = parse_html("西游记")
 8     print(data1)
 9     print(data2)
10     print(data3)
11     print(data4)
12     print('end')
结果截图:
2,#将数据写入.csv文件
1 #将数据写入.csv文件
2 write_("红楼梦",data1)
3 write_("水浒传",data2)
4 write_("三国演义",data3)
5 write_("西游记",data4)
3,#定义函数,读取csv文件并将信息按列分离
 1 #定义函数,读取csv文件并将信息按列分离
 2 import os
 3 import pandas as pd
 4 import csv
 5
 6 def open_data(book):
 7 mxdPath=r"C:\Users\73916\\" + book + r".csv"
 8 file=open(mxdPath)
 9 content = csv.reader(file) ##reader(f)读取文件中的一行,read()只能读取一个字符
10 data = []
11 Type = []
12 Name = []
13 Year = []
14 People = []
15 Mark = []
16 for piece in content:
17 data.append(piece)
18 #print(data)
19 for piece in data[1::]:#第一行为各列名称,所以从第二行开始截取,即data[1]
20 Type.append(piece[0])
21 Name.append(piece[1])
22 Year.append(piece[2])
23 People.append(piece[3])
24 Mark.append(piece[4])
25 #print(content)
26 file.close()
27 content = [Type, Name, Year, People, Mark]
28 return content
4,#打开四个表格
1 content1 = open_data('红楼梦')
2 print(content1[0])
3 content2 = open_data('西游记')
4 print(content2[0])
5 content3 = open_data('水浒传')
6 print(content3[0])
7 content4 = open_data('三国演义')
8 print(content4[0])

5,#定义函数,对于爬到的产品类型进行分析
 1 #定义函数,对于爬到的产品类型进行分析
 2 def ana_type(book,Type):
 3 type_dict = {}
 4
 5 for data in Type: #统计各个类型的产品数量,不同类型作为字典的key
 6 if data not in type_dict.keys(): #如果该key不存在,则将value值初始化为1
 7 type_dict[data] = 1
 8 else: #如果该key存在,则将value值加1
 9 type_dict[data] +=1
10
11 #print (type_dict)
12 num = []
13 typename = []
14 explode = []
15 print(type_dict)
16 for key,value in type_dict.items():
17 typename.append(key)
18 num.append(value)
19 for name in typename:
20 explode.append(0)
21 explode = tuple(explode)
22 #for key in type_dict
23 drawpie(book,typename, num,explode)
24 return num
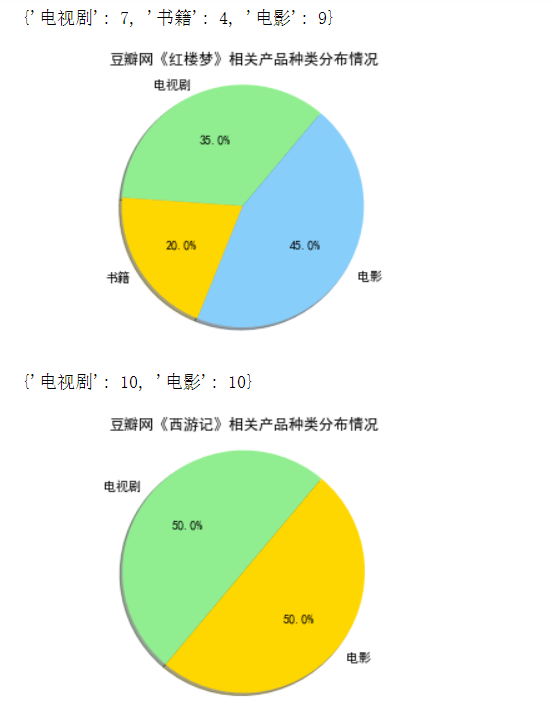
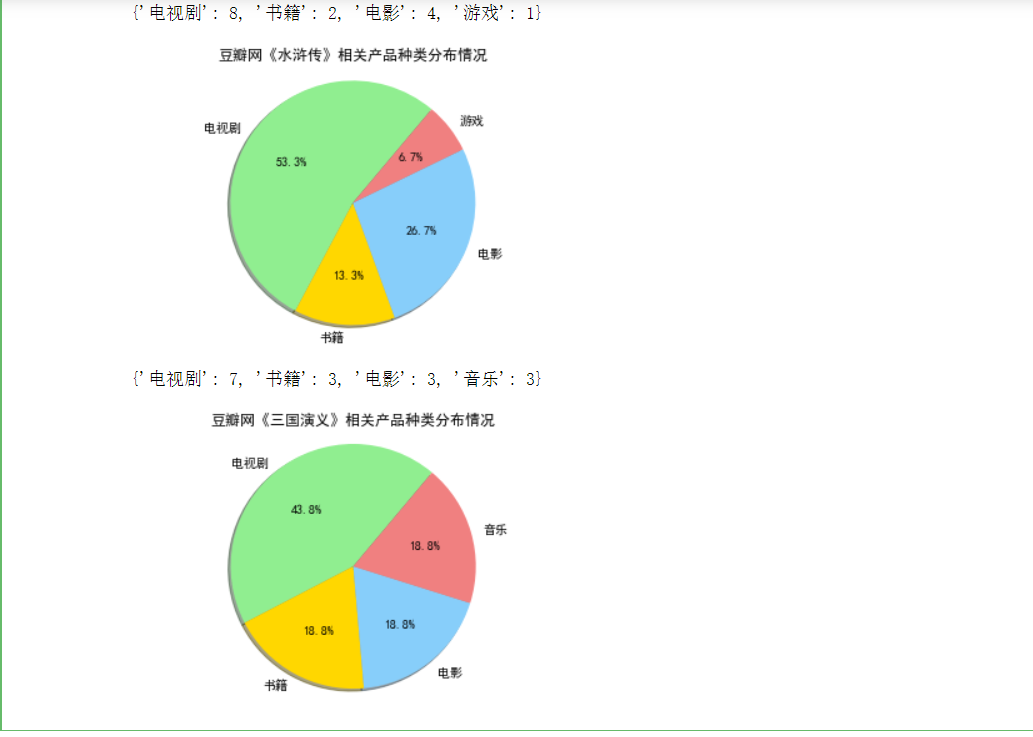
6,#定义函数,绘制饼状图
 1 import matplotlib.pyplot as plt
 2 from pylab import mpl#字体
 3 #设置字体
 4
 5 def drawpie(book,name,num,explode):#画饼状图
 6 mpl.rcParams['font.sans-serif'] = ['SimHei']
 7 plt.title("豆瓣网《" + book + "》相关产品种类分布情况")
 8 sizes=num
 9 colors='lightgreen','gold','lightskyblue','lightcoral'
10 #explode=0,0,0
11 #print(type(explode))
12 plt.pie(sizes,explode=explode,labels=name,
13 colors=colors,autopct='%1.1f%%',shadow=True,startangle=50)
14 plt.axis('equal')
15 plt.show()
16 #分析四大名著相关产品的类型分布,并绘制对应的饼状图,类型为表格中的第一列(content[0])
17
18 #分析四大名著相关产品的类型分布,并绘制对应的饼状图,类型为表格中的第一列(content[0])
19 num1 = ana_type("红楼梦",content1[0])
20 num2 = ana_type("西游记",content2[0])
21 num3 = ana_type("水浒传",content3[0])
22 num4 = ana_type("三国演义",content4[0])
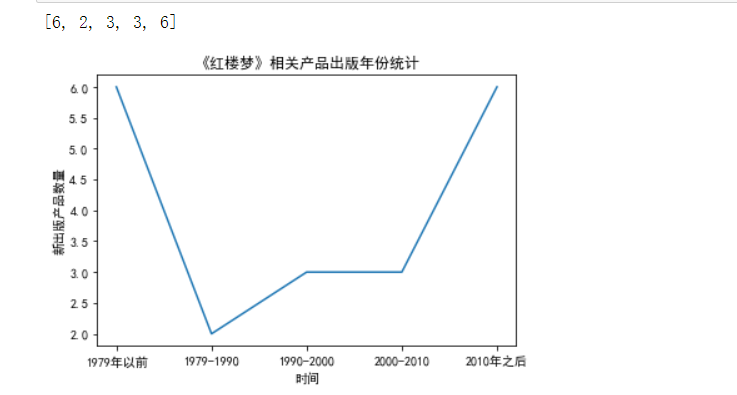
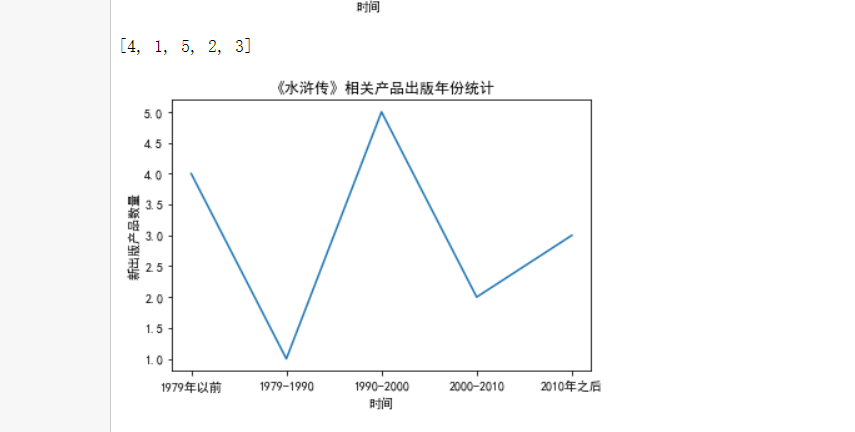
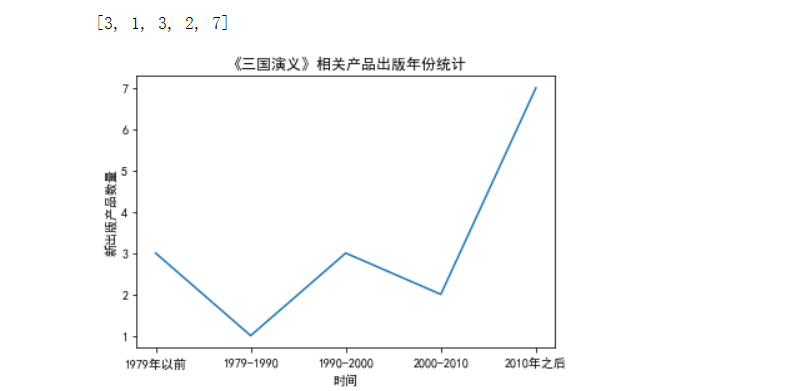
7,#定义函数,对于爬到的产品出版年份进行分析
 1 #定义函数,对于爬到的产品出版年份进行分析
 2 def ana_year(book,Year):
 3 num = [0,0,0,0,0]
 4 for data in Year:
 5 data = int(data)
 6 if data < 1979:
 7 num[0] += 1
 8 elif data < 1990:
 9 num[1] += 1
10 elif data < 2000:
11 num[2] += 1
12 elif data < 2010:
13 num[3] +=1
14 else:
15 num[4] += 1
16 #print (type_dict)
17 print(num)
18 drawyear(book,num)
19
20 #定义函数,绘制出版年份柱状图
21 import matplotlib.pyplot as plt
22 from pylab import mpl#字体
23 #解决中文显示问题
24 from matplotlib import mlab
25 from matplotlib import rcParams
26
27
28 def drawyear(book, count):#画折线图
29 mpl.rcParams['font.sans-serif'] = ['SimHei']
30 plt.title("《" + book + "》相关产品出版年份统计")
31 name_list = ['1979年以前', '1979-1990', '1990-2000', '2000-2010', '2010年之后']
32 plt.xlabel("时间")
33 plt.ylabel("新出版产品数量")
34
35 #y1= [2,4,7,2,4]
36
37 plt.plot(name_list, count)
38 #plt.plot(x, y2)
39
40 #plt.xticks((0,1,2,3,4),('1979年以前', '1979-1990', '1990-2000' , '2000-2010', '2010年之后'))
41
42 #plt.bar(x = (0,1,2,3),height = distance,width = 0.35,align="center")
43
44 #rect = plt.bar(x = (0,1,2,3,4),height = count,width = 0.35,align="center")
45
46 #autolabel(rect)
47
48 plt.show()
49 #print(count)
50 return count
51
52 #分析出版年份,对应表格中的第三列(content[2])
53 ana_year("红楼梦",content1[2])
54 ana_year("西游记",content2[2])
55 ana_year("水浒传",content3[2])
56 ana_year("三国演义",content4[2])

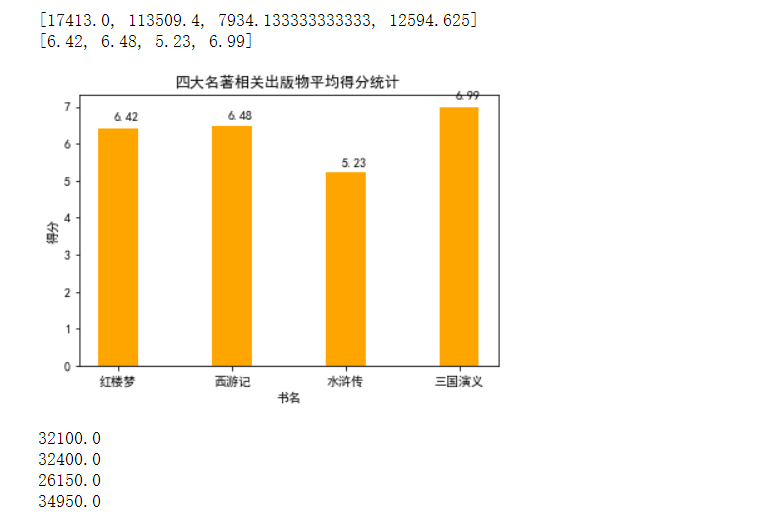
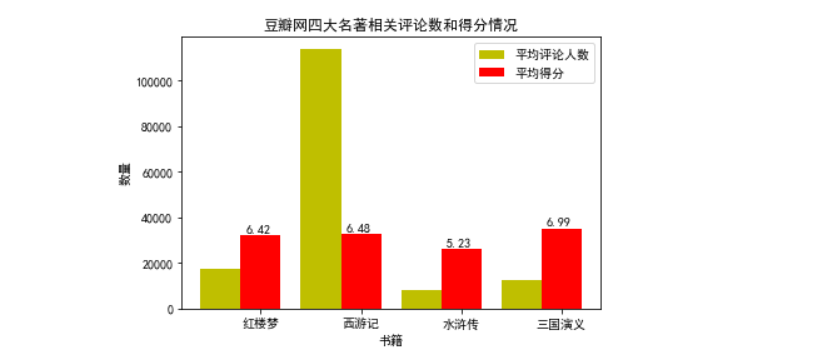
8,#定义函数,分析四大名著的评价人数和得分情况
  1 #定义函数,分析四大名著的评价人数和得分情况
  2 def ana_mark(people, mark):
  3 sum_ = [0,0,0,0]
  4 mark_ = [0,0,0,0]
  5 for i in range(4):
  6 for data in people[i]:
  7 if data == 0:
  8 contimue
  9 else:
 10 sum_[i] += int(data)
 11 for data in mark[i]:
 12 if data == 0:
 13 contimue
 14 else:
 15 mark_[i] += float(data)
 16 sum_[i] = sum_[i] / len(people[i])
 17 mark_[i] = mark_[i] / len(mark[i])
 18 print(sum_)
 19 drawmark(mark_)
 20 draw_mark(sum_,mark_)
 21
 22 #定义函数,画四大名著得分比较的柱状图
 23 def autolabel(rects):#在柱状图上显示数量坐标
 24 for rect in rects:
 25 height = rect.get_height()
 26 plt.text(rect.get_x()+0.14, 1.03*height, '%s' % height)
 27
 28 def drawmark(mark):
 29 mpl.rcParams['font.sans-serif'] = ['SimHei']
 30
 31 plt.title("四大名著相关出版物平均得分统计")
 32 name_list = ['红楼梦', '西游记', '水浒传', '三国演义']
 33 plt.xlabel("书名")
 34 plt.ylabel("得分")
 35
 36 plt.xticks((0,1,2,3),('红楼梦', '西游记', '水浒传', '三国演义'))
 37 #print(type(mark[0]))
 38
 39 #plt.bar(x = (0,1,2,3),height = distance,width = 0.35,align="center")
 40 #my_y_ticks = np.arange(0, 7, 0.05)
 41 #plt.yticks(my_y_ticks)
 42 for i in range(4):
 43 mark[i] = round(mark[i],2) #将评分保留至小数点后两位
 44 #print(data)
 45 print(mark)
 46 rect = plt.bar(x = (0,1,2,3),height = mark,width = 0.35,align="center",color = 'orange')
 47 #rect = plt.bar(x = (0,1,2,3,4),height = count,width = 0.35,align="center")
 48 height = mark
 49 #print(type(height[0]))
 50 autolabel(rect) #显示柱状图的数值
 51
 52 plt.show()
 53 #print(count)
 54 #return count
 55
 56
 57
 58 #定义函数,绘制并列柱状图,分析评价人数和得分
 59 import matplotlib.pyplot as plt
 60 import numpy as np
 61 def autolabel2(rects2):#在柱状图上显示数量坐标
 62 for rect in rects2:
 63 height = round(rect.get_height(),2)
 64 print(height)
 65 plt.text(rect.get_x()+0.05, 1.03*height, '%s' % round(height/5000,2)) #设置显示坐标位置和数值
 66
 67 def draw_mark(sum_, mark_):
 68 name_list = ['红楼梦', '西游记', '水浒传', '三国演义']
 69 y_list = sum_
 70 for i in range(4):
 71 mark_[i] = round(mark_[i],2) #将评分保留至小数点后两位
 72 #print(mark_[i])
 73 mark_[i] = 5000 * mark_[i]
 74 #print(mark_[i])
 75 #print(sum_)
 76
 77 #print(mark_)
 78 y_list2 = mark_
 79 #bar_width = 0.3
 80 #size = 4
 81 #x = np.random.random(len(x_data))
 82 x =list(range(len(y_list)))
 83 total_width, n = 0.8, 2
 84 width = total_width / n
 85 #绘制柱状图
 86
 87 # 在柱状图上显示具体数值, ha参数控制水平对齐方式, va控制垂直对齐方式
 88 #for x, y in enumerate(y_data):
 89 #plt.text(x, y + 100, '%s' % y, ha='center', va='bottom')
 90 #for x, y in enumerate(y_data2):
 91 #plt.text(x+bar_width, y + 100, '%s' % y, ha='center', va='top')
 92 rect = plt.bar(x, y_list, width=width, label='平均评论人数',fc = 'y')
 93 for i in range(len(x)):
 94 x[i] = x[i] + width
 95 rect2 = plt.bar(x, y_list2, width=width, label='平均得分',tick_label = name_list,fc = 'r')
 96 plt.legend()
 97 #plt.show()
 98 #设置标题
 99 plt.title("豆瓣网四大名著相关评论数和得分情况")
100 plt.xlabel("书籍")
101 plt.ylabel("数量")
102 autolabel2(rect2)
103 #plt.legend()
104 plt.show()
105
106
107
108 #分析四大名著相关出版物平均得分和评价人数
109 people = [content1[3],content2[3],content3[3],content4[3]]
110 mark = [content1[4],content2[4],content3[4],content4[4]]
111 ana_mark(people,mark)
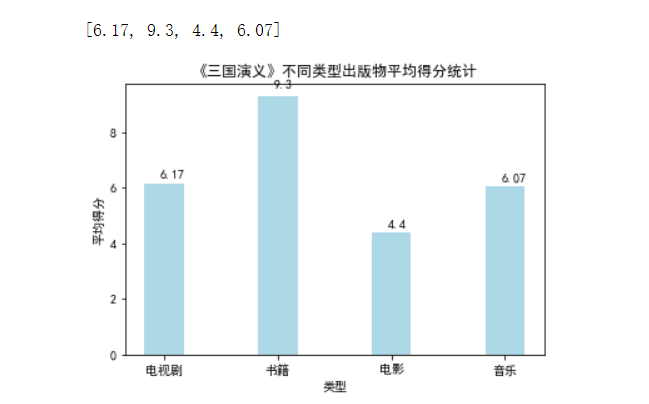
 1 def ana_typemark(book, type_, num, mark_): #type_为各类书籍的类型,mark_为得分列表,num为不同类型的产品数量
 2 type_dict = {}
 3 for i in range(1,len(type_)):#遍历列表中的各个元素
 4 if type_[i] not in type_dict.keys(): #如果该key不存在,则将value值初始化为该组数据得分
 5 type_dict[type_[i]] = float(mark_[i])
 6 else: #如果该key存在,则将value值加1
 7 type_dict[type_[i]] += float(mark_[i])
 8
 9 sum_ = []
10 typename = [] #类型名称列表
11 average = [] #各个类型对应的平均分
12 explode = []
13 for key,value in type_dict.items():
14 typename.append(key)
15 sum_.append(value)
16 explode.append(0)
17 i = 0
18 for key,value in type_dict.items():
19 average.append(value/num[i])
20 i += 1
21 explode = tuple(explode)
22 drawtype(book,typename, average,explode)
23
24
25
26 #定义函数,画四大名著不同类型得分比较的柱状图
27 def drawtype(book,typename, average,explode):
28 mpl.rcParams['font.sans-serif'] = ['SimHei']
29
30 plt.title("《" + book + "》不同类型出版物平均得分统计")
31 name_list = typename
32 plt.xlabel("类型")
33 plt.ylabel("平均得分")
34 list1 = []
35 for i in range(len(typename)):
36 list1.append(i)
37 list1 = tuple(list1)
38 typename = tuple(typename)
39 #plt.xticks((0,1,2,3),('红楼梦', '西游记', '水浒传', '三国演义'))
40 plt.xticks(list1,typename) #参数要求为元组,强制类型转换
41 #print(type(mark[0]))
42
43 #plt.bar(x = (0,1,2,3),height = distance,width = 0.35,align="center")
44 #my_y_ticks = np.arange(0, 7, 0.05)
45 #plt.yticks(my_y_ticks)
46 for i in range(len(typename)):
47 average[i] = round(average[i],2) #将评分保留至小数点后两位
48 #print(data)
49 print(average)
50 rect = plt.bar(x = list1,height = average,width = 0.35,align="center",color = 'lightblue')
51 #rect = plt.bar(x = (0,1,2,3,4),height = count,width = 0.35,align="center")
52 height = average
53 #print(type(height[0]))
54 autolabel(rect) #显示柱状图的数值
55
56 plt.show()
57 #print(count)
58 #return count
59
60 ana_typemark("红楼梦", content1[0], num1, content1[4])
61 ana_typemark("西游记", content2[0], num2, content2[4])
62 ana_typemark("水浒传", content3[0], num3, content3[4])
63 ana_typemark("三国演义", content4[0], num4, content4[4])


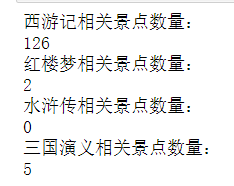
 1 import requests
 2 from bs4 import BeautifulSoup
 3
 4 def travelnum(place):
 5 Num = 0
 6 for i in range(10): #四类景区的搜索结果页数均不超过10
 7 url = "https://vacations.ctrip.com/whole-1B126P" + str(i+1) + "/?searchvalue=" + place #翻页,循环爬取
 8 # 将cookies字符串组装为字典
 9 cookies_str = '复制粘贴对应网站cookies'
10 cookies_dict = {}
11 # 其他请求头参数
12 headers = {
13 'User-Agent': 'Mozilla/5.0 (Windows NT 6.1; Win64; x64) AppleWebKit/537.36 (KHTML, like Gecko) Chrome/58.0.3029.110 Safari/537.36'
14 }
15 # 访问页面
16 page = requests.get(url=url, cookies=cookies_dict, headers=headers)
17 soup = BeautifulSoup(page.text, 'lxml')
18 all_divs = soup.find_all('div', class_='product_main')
19 travel_divs = [div.get_text() for div in all_divs]
20 num = len(travel_divs)
21 #print(num)
22 Num += num
23 if num < 30:
24 break
25 return Num
26
27 num1 = travelnum('西游记')
28 print("西游记相关景点数量:")
29 print(num1)
30 num2 = travelnum('红楼梦')
31 print("红楼梦相关景点数量:")
32 print(num2)
33 num3= travelnum('水浒传')
34 print("水浒传相关景点数量:")
35 print(num3)
36 num4 = travelnum('三国演义')
37 print("三国演义相关景点数量:")
38 print(num4)
39 content = [num1,num2,num3,num4]
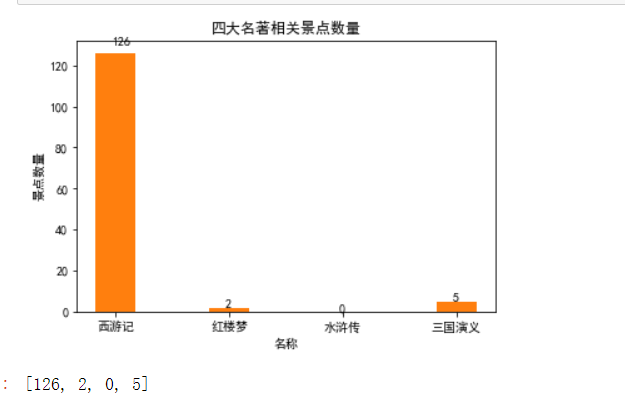
 1 import matplotlib.pyplot as plt
 2 from pylab import mpl#字体
 3 #设置字体
 4 from matplotlib import mlab
 5 from matplotlib import rcParams
 6
 7 def draw(count):#画柱状图
 8 mpl.rcParams['font.sans-serif'] = ['SimHei']
 9 plt.title("四大名著相关景点数量")
10 name_list = ['西游记', '红楼梦', '水浒传', '三国演义']
11 #number=[dis1,dis2,dis3,dis4]
12 plt.xlabel("名称")
13 plt.ylabel("景点数量")
14
15 plt.xticks((0,1,2,3),('西游记', '红楼梦', '水浒传', '三国演义'))
16
17 #plt.bar(x = (0,1,2,3),height = distance,width = 0.35,align="center")
18
19 rect = plt.bar(x = (0,1,2,3),height = count,width = 0.35,align="center")
20 rect = plt.bar(x = (0,1,2,3),height = count,width = 0.35,align="center")
21 autolabel(rect)
22
23 plt.show()
24 #print(count)
25 return count
26 draw(content)
9, #分别统计四本书中出现次数最多的二十个词组
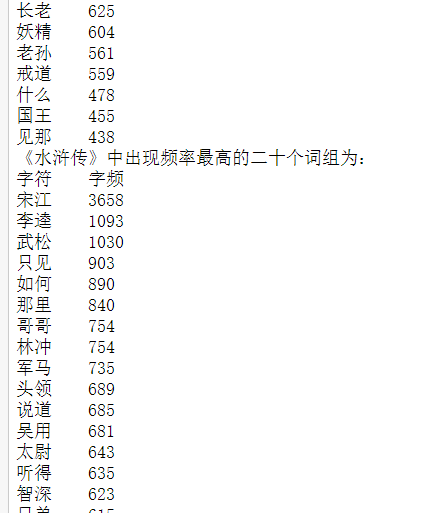
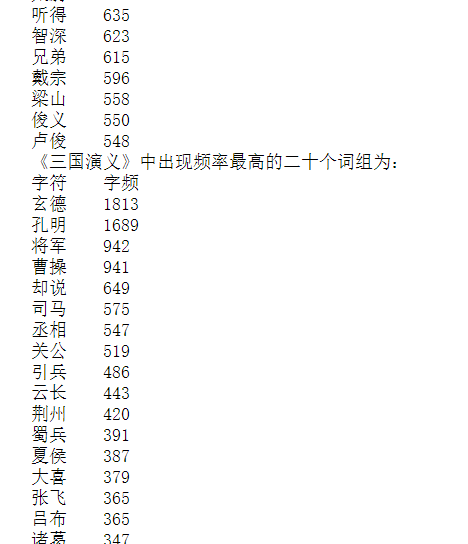
 1 #分别统计四本书中出现次数最多的二十个词组
 2 import os
 3 def maxword(book, path):
 4 exclude_str = ",。!?、()【】<>《》=:+-*—“”‘’… ;\n了你我她他的\u3000不一来人这儿是下此着个子下上曰之有" #除去标点符号和无用字符
 5 f = open(path,encoding = 'gb18030')
 6 content = []
 7
 8 for line in f: #将每个词组存储到列表中
 9 #line = list(line)
10 for i in range(len(line)-1): #除去标点符号和无用字符
11 if line[i] not in exclude_str:
12 if line[i+1] not in exclude_str:
13 content.append(line[i]+line[i+1])
14
15 count={} #统计每个字出现的数量
16 for character in content:
17 count.setdefault(character,0) #如果键不存在于字典中,将会添加键并将值设为默认值
18 count[character] = count[character] + 1
19 # 排序
20 # x[1]是按字频排序,x[0]则是按字排序
21 lstWords = sorted(count.items(), key=lambda x:x[1], reverse=True)
22 print(book + "中出现频率最高的二十个词组为:")
23 print ('字符\t字频')
24 for e in lstWords[:20]:
25 #print(e)
26 print ('%s\t%d' % e)
27 #print(count)
28 f.close()
29
30 maxword("《红楼梦》", "D:\python\大作业\红楼梦.txt")
31 maxword("《西游记》", r"D:\python\大作业\西游记.txt")
32 maxword("《水浒传》", r"D:\python\大作业\水浒传.txt")
33 maxword("《三国演义》", r"D:\python\大作业\三国演义.txt")

完整代码:
  1 #定义爬取豆瓣网信息函数
  2 import requests
  3 from bs4 import BeautifulSoup
  4
  5 def parse_html(book):
  6     headers = {
  7         'User-Agent': 'Mozilla/5.0 (Windows NT 6.1; Win64; x64) AppleWebKit/537.36 (KHTML, like Gecko) Chrome/58.0.3029.110 Safari/537.36'
  8     }
  9     response = requests.get(f'https://www.douban.com/search?q=' + book ,headers=headers)
 10     #response = requests.get(f'https://book.douban.com/top250?start={num}', headers=headers)
 11     soup = BeautifulSoup(response.text, 'lxml')
 12     #print(soup)
 13
 14     #类型和名称
 15     all_Type = soup.find_all('h3')
 16     book_names = [Type.get_text() for Type in all_Type]
 17     leixing = []
 18     mingcheng = []
 19     for piece in book_names:
 20         if "小组" in piece:
 21             continue
 22         elif "日记" in piece:
 23             continue
 24         else:  #首先去除爬取到的多余信息
 25             piece  = piece.strip().replace(' ', '')
 26             piece = piece.strip().replace('[', '')
 27             piece = piece.strip().replace('可播放', '')
 28             piece = piece.strip().replace('可试读', '')
 29             piece = piece.strip().replace('有电子版', '')
 30             piece = piece.strip().replace('\n', '')
 31             piece = piece.strip().replace('\xa0', '')
 32             str1 = piece.split(']')
 33             if book in str1[0]:
 34                 continue
 35             else:
 36                 leixing.append(str1[0])
 37                 mingcheng.append(str1[1])
 38             #for i in str1:
 39                # print(i)
 40     #print(len(leixing))
 41     #print(mingcheng)
 42
 43
 44     #出版年份ok
 45     all_year = soup.find_all('span', class_='subject-cast')
 46     nianfen = []
 47     book_years = [year.get_text() for year in all_year]
 48     for piece in book_years:
 49         str1 = piece.split(' ')
 50         try:
 51             nianfen.append(int(str1[-1]))  #在获得数据中摘取出版年份
 52         except:    #抛出异常,排除没有出版年份(即对应位置数据不能转换成int型数据)的情况
 53             nianfen.append(0)
 54     #print(len(nianfen))
 55
 56
 57     #评价人数ok
 58     all_people = soup.find_all('span',class_='')
 59     book_people = [people.get_text() for people in all_people]
 60     renshu = []
 61     i=0
 62     for piece in book_people:
 63         if '[' not in piece:
 64             i +=1
 65         else:
 66             break
 67     book_people = book_people[i::]    #摘除开头多余的信息
 68
 69     for piece in book_people:
 70         if '日记' in piece:
 71             continue
 72         elif '小组' in piece:
 73             continue
 74             #print(piece)
 75         elif '人评价' in piece:   #摘取含有评价人数的元素
 76             piece = piece.strip('(').strip(')')
 77             piece = piece.strip("人评价")   #去除字符串中多余指定字符
 78             renshu.append(int(piece))
 79         elif "(" in piece:  #对于“暂未上映”或者“尚无评价”的数据,将评价人数赋为0
 80             renshu.append(0)
 81         #else:
 82             #renshu.append(0)
 83     #print(type(book_people))
 84     #print(len(renshu))
 85     #print(renshu)
 86
 87     #评分ok
 88     all_mark = soup.find_all('span', class_='rating_nums')
 89     book_rates = [mark.get_text() for mark in all_mark]
 90     #print(len(book_rates))
 91     pingfen = []
 92     for i in range(len(mingcheng)):  #不能用len(book_rates),某些无评分的数据未导入,book_rates长度比其他列表短,会造成信息错乱
 93         if renshu[i] ==0:
 94             pingfen.append(float(0))  #对于无评分的数据将评分补成0
 95             book_rates.insert(i,'0')  #
 96         else:
 97             pingfen.append(float(book_rates[i]))
 98     #print(len(pingfen))
 99     #print(len(mingcheng))
100     #print(pingfen)
101
102     content = []
103     content = [leixing, mingcheng, nianfen, renshu, pingfen]
104     return content
105
106
107
108
109 #为方便观察爬取到的结果,将数据写入csv文件,定义写入格式
110 import csv
111 import pandas as pd
112 #csv 写入
113
114 def write_(book,content):
115     #Type.append('type')
116     #Name.append('name')
117     content[0].insert(0,"类型")
118     content[1].insert(0,"名称")
119     content[2].insert(0,"出版年份")
120     content[3].insert(0,"评价人数")
121     content[4].insert(0,"评分")
122     file1= open(book + '.csv','a+', newline='')
123     #a+:打开一个文件用于读写。如果该文件已存在,文件指针将会放在文件的结尾。文件打开时会是追加模式。如果该文件不存在,创建新文件用于读写。
124     #设定写入模式
125     csv_write = csv.writer(file1,dialect='excel')
126     #写入具体内容
127     #dataframe1 = pd.DataFrame({'Type':Type,'Name':Name})
128
129     for val in zip(content[0],content[1],content[2],content[3],content[4]):
130         csv_write.writerow(val)
131     #csv_write.writerow(Type)
132     #csv_write.writerow(Name)
133     file1.close()
134     print ("write over")
135
136
137
138
139
140 #从豆瓣网上爬取四大名著相关产品的数据
141 if __name__ == '__main__':
142     print('begin')
143     data1 = parse_html("红楼梦")
144     data2 = parse_html("水浒传")
145     data3 = parse_html("三国演义")
146     data4 = parse_html("西游记")
147     print(data1)
148     print(data2)
149     print(data3)
150     print(data4)
151     print('end')
152
153
154
155
156 #将数据写入.csv文件
157 write_("红楼梦",data1)
158 write_("水浒传",data2)
159 write_("三国演义",data3)
160 write_("西游记",data4)
161
162
163
164
165
166 #定义函数,读取csv文件并将信息按列分离
167 import os
168 import pandas as pd
169 import csv
170
171 def open_data(book):
172     mxdPath=r"C:\Users\73916\\" + book + r".csv"
173     file=open(mxdPath)
174     content = csv.reader(file)   ##reader(f)读取文件中的一行,read()只能读取一个字符
175     data = []
176     Type = []
177     Name = []
178     Year = []
179     People = []
180     Mark = []
181     for piece in content:
182         data.append(piece)
183     #print(data)
184     for piece in data[1::]:#第一行为各列名称,所以从第二行开始截取,即data[1]
185         Type.append(piece[0])
186         Name.append(piece[1])
187         Year.append(piece[2])
188         People.append(piece[3])
189         Mark.append(piece[4])
190     #print(content)
191     file.close()
192     content = [Type, Name, Year, People, Mark]
193     return content
194
195
196
197 #打开四个表格
198 content1 = open_data('红楼梦')
199 print(content1[0])
200 content2 = open_data('西游记')
201 print(content2[0])
202 content3 = open_data('水浒传')
203 print(content3[0])
204 content4 = open_data('三国演义')
205 print(content4[0])
206
207
208
209
210
211 #定义函数,对于爬到的产品类型进行分析
212 def ana_type(book,Type):
213     type_dict = {}
214
215     for data in Type:   #统计各个类型的产品数量,不同类型作为字典的key
216         if data not in type_dict.keys():   #如果该key不存在,则将value值初始化为1
217             type_dict[data] = 1
218         else:     #如果该key存在,则将value值加1
219             type_dict[data] +=1
220
221     #print (type_dict)
222     num = []
223     typename = []
224     explode = []
225     print(type_dict)
226     for key,value in type_dict.items():
227         typename.append(key)
228         num.append(value)
229     for name in typename:
230         explode.append(0)
231     explode = tuple(explode)
232     #for key in type_dict
233     drawpie(book,typename, num,explode)
234     return num
235
236
237
238
239
240 #定义函数,绘制饼状图
241 import matplotlib.pyplot as plt
242 from pylab import mpl#字体
243 #设置字体
244
245 def drawpie(book,name,num,explode):#画饼状图
246     mpl.rcParams['font.sans-serif'] = ['SimHei']
247     plt.title("豆瓣网《" + book + "》相关产品种类分布情况")
248     sizes=num
249     colors='lightgreen','gold','lightskyblue','lightcoral'
250     #explode=0,0,0
251     #print(type(explode))
252     plt.pie(sizes,explode=explode,labels=name,
253             colors=colors,autopct='%1.1f%%',shadow=True,startangle=50)
254     plt.axis('equal')
255     plt.show()
256
257
258
259
260
261 #分析四大名著相关产品的类型分布,并绘制对应的饼状图,类型为表格中的第一列(content[0])
262 num1 = ana_type("红楼梦",content1[0])
263 num2 = ana_type("西游记",content2[0])
264 num3 = ana_type("水浒传",content3[0])
265 num4 = ana_type("三国演义",content4[0])
266
267
268
269
270
271
272     #定义函数,对于爬到的产品出版年份进行分析
273 def ana_year(book,Year):
274     num = [0,0,0,0,0]
275     for data in Year:
276         data = int(data)
277         if data < 1979:
278             num[0] += 1
279         elif data < 1990:
280             num[1] += 1
281         elif data < 2000:
282             num[2] += 1
283         elif data < 2010:
284             num[3] +=1
285         else:
286             num[4] += 1
287     #print (type_dict)
288     print(num)
289     drawyear(book,num)
290
291
292
293
294
295 #定义函数,绘制出版年份柱状图
296 import matplotlib.pyplot as plt
297 from pylab import mpl#字体
298 #解决中文显示问题
299 from matplotlib import mlab
300 from matplotlib import rcParams
301
302
303 def drawyear(book, count):#画折线图
304     mpl.rcParams['font.sans-serif'] = ['SimHei']
305     plt.title("《" + book + "》相关产品出版年份统计")
306     name_list = ['1979年以前', '1979-1990', '1990-2000', '2000-2010', '2010年之后']
307     plt.xlabel("时间")
308     plt.ylabel("新出版产品数量")
309
310     #y1= [2,4,7,2,4]
311
312     plt.plot(name_list, count)
313     #plt.plot(x, y2)
314
315     #plt.xticks((0,1,2,3,4),('1979年以前', '1979-1990', '1990-2000' , '2000-2010', '2010年之后'))
316
317     #plt.bar(x = (0,1,2,3),height = distance,width = 0.35,align="center")
318
319     #rect = plt.bar(x = (0,1,2,3,4),height = count,width = 0.35,align="center")
320
321     #autolabel(rect)
322
323     plt.show()
324     #print(count)
325     return count
326
327
328
329
330 #分析出版年份,对应表格中的第三列(content[2])
331 ana_year("红楼梦",content1[2])
332 ana_year("西游记",content2[2])
333 ana_year("水浒传",content3[2])
334 ana_year("三国演义",content4[2])
335
336
337
338
339 #定义函数,分析四大名著的评价人数和得分情况
340 def ana_mark(people, mark):
341     sum_ = [0,0,0,0]
342     mark_ = [0,0,0,0]
343     for i in range(4):
344         for data in people[i]:
345             if data == 0:
346                 contimue
347             else:
348                 sum_[i] += int(data)
349         for data in mark[i]:
350             if data == 0:
351                 contimue
352             else:
353                 mark_[i] += float(data)
354         sum_[i] = sum_[i] / len(people[i])
355         mark_[i] = mark_[i] / len(mark[i])
356     print(sum_)
357     drawmark(mark_)
358     draw_mark(sum_,mark_)
359
360
361
362
363 #定义函数,画四大名著得分比较的柱状图
364 def autolabel(rects):#在柱状图上显示数量坐标
365     for rect in rects:
366         height = rect.get_height()
367         plt.text(rect.get_x()+0.14, 1.03*height, '%s' % height)
368
369 def drawmark(mark):
370     mpl.rcParams['font.sans-serif'] = ['SimHei']
371
372     plt.title("四大名著相关出版物平均得分统计")
373     name_list = ['红楼梦', '西游记', '水浒传', '三国演义']
374     plt.xlabel("书名")
375     plt.ylabel("得分")
376
377     plt.xticks((0,1,2,3),('红楼梦', '西游记', '水浒传', '三国演义'))
378     #print(type(mark[0]))
379
380     #plt.bar(x = (0,1,2,3),height = distance,width = 0.35,align="center")
381     #my_y_ticks = np.arange(0, 7, 0.05)
382     #plt.yticks(my_y_ticks)
383     for i in range(4):
384         mark[i] = round(mark[i],2)  #将评分保留至小数点后两位
385         #print(data)
386     print(mark)
387     rect = plt.bar(x = (0,1,2,3),height = mark,width = 0.35,align="center",color = 'orange')
388     #rect = plt.bar(x = (0,1,2,3,4),height = count,width = 0.35,align="center")
389     height = mark
390     #print(type(height[0]))
391     autolabel(rect)  #显示柱状图的数值
392
393     plt.show()
394     #print(count)
395     #return count
396
397
398
399
400 #定义函数,绘制并列柱状图,分析评价人数和得分
401 import matplotlib.pyplot as plt
402 import numpy as np
403 def autolabel2(rects2):#在柱状图上显示数量坐标
404     for rect in rects2:
405         height = round(rect.get_height(),2)
406         print(height)
407         plt.text(rect.get_x()+0.05, 1.03*height, '%s' % round(height/5000,2))   #设置显示坐标位置和数值
408
409 def draw_mark(sum_, mark_):
410     name_list = ['红楼梦', '西游记', '水浒传', '三国演义']
411     y_list = sum_
412     for i in range(4):
413         mark_[i] = round(mark_[i],2)  #将评分保留至小数点后两位
414         #print(mark_[i])
415         mark_[i] = 5000 * mark_[i]
416         #print(mark_[i])
417     #print(sum_)
418
419     #print(mark_)
420     y_list2 = mark_
421     #bar_width = 0.3
422     #size = 4
423     #x = np.random.random(len(x_data))
424     x =list(range(len(y_list)))
425     total_width, n = 0.8, 2
426     width = total_width / n
427     #绘制柱状图
428
429     # 在柱状图上显示具体数值, ha参数控制水平对齐方式, va控制垂直对齐方式
430     #for x, y in enumerate(y_data):
431         #plt.text(x, y + 100, '%s' % y, ha='center', va='bottom')
432     #for x, y in enumerate(y_data2):
433         #plt.text(x+bar_width, y + 100, '%s' % y, ha='center', va='top')
434     rect = plt.bar(x, y_list, width=width, label='平均评论人数',fc = 'y')
435     for i in range(len(x)):
436         x[i] = x[i] + width
437     rect2 = plt.bar(x, y_list2, width=width, label='平均得分',tick_label = name_list,fc = 'r')
438     plt.legend()
439     #plt.show()
440     #设置标题
441     plt.title("豆瓣网四大名著相关评论数和得分情况")
442     plt.xlabel("书籍")
443     plt.ylabel("数量")
444     autolabel2(rect2)
445     #plt.legend()
446     plt.show()
447
448
449
450
451 #分析四大名著相关出版物平均得分和评价人数
452 people = [content1[3],content2[3],content3[3],content4[3]]
453 mark = [content1[4],content2[4],content3[4],content4[4]]
454 ana_mark(people,mark)
455
456
457
458
459 def ana_typemark(book, type_, num, mark_):   #type_为各类书籍的类型,mark_为得分列表,num为不同类型的产品数量
460     type_dict = {}
461     for i in range(1,len(type_)):#遍历列表中的各个元素
462         if type_[i] not in type_dict.keys():   #如果该key不存在,则将value值初始化为该组数据得分
463             type_dict[type_[i]] = float(mark_[i])
464         else:     #如果该key存在,则将value值加1
465             type_dict[type_[i]] += float(mark_[i])
466
467     sum_ = []
468     typename = []  #类型名称列表
469     average = []   #各个类型对应的平均分
470     explode = []
471     for key,value in type_dict.items():
472         typename.append(key)
473         sum_.append(value)
474         explode.append(0)
475     i = 0
476     for key,value in type_dict.items():
477         average.append(value/num[i])
478         i += 1
479     explode = tuple(explode)
480     drawtype(book,typename, average,explode)
481
482
483
484
485 #定义函数,画四大名著不同类型得分比较的柱状图
486 def drawtype(book,typename, average,explode):
487     mpl.rcParams['font.sans-serif'] = ['SimHei']
488
489     plt.title("《" + book + "》不同类型出版物平均得分统计")
490     name_list = typename
491     plt.xlabel("类型")
492     plt.ylabel("平均得分")
493     list1 = []
494     for i in range(len(typename)):
495         list1.append(i)
496     list1 = tuple(list1)
497     typename = tuple(typename)
498     #plt.xticks((0,1,2,3),('红楼梦', '西游记', '水浒传', '三国演义'))
499     plt.xticks(list1,typename)  #参数要求为元组,强制类型转换
500     #print(type(mark[0]))
501
502     #plt.bar(x = (0,1,2,3),height = distance,width = 0.35,align="center")
503     #my_y_ticks = np.arange(0, 7, 0.05)
504     #plt.yticks(my_y_ticks)
505     for i in range(len(typename)):
506         average[i] = round(average[i],2)  #将评分保留至小数点后两位
507         #print(data)
508     print(average)
509     rect = plt.bar(x = list1,height = average,width = 0.35,align="center",color = 'lightblue')
510     #rect = plt.bar(x = (0,1,2,3,4),height = count,width = 0.35,align="center")
511     height = average
512     #print(type(height[0]))
513     autolabel(rect)  #显示柱状图的数值
514
515     plt.show()
516     #print(count)
517     #return count
518
519
520
521 ana_typemark("红楼梦", content1[0], num1, content1[4])
522 ana_typemark("西游记", content2[0], num2, content2[4])
523 ana_typemark("水浒传", content3[0], num3, content3[4])
524 ana_typemark("三国演义", content4[0], num4, content4[4])
525
526
527 import requests
528 from bs4 import BeautifulSoup
529
530 def travelnum(place):
531     Num = 0
532     for i in range(10):  #四类景区的搜索结果页数均不超过10
533         url = "https://vacations.ctrip.com/whole-1B126P" + str(i+1) + "/?searchvalue=" + place    #翻页,循环爬取
534         # 将cookies字符串组装为字典
535         cookies_str = '复制粘贴对应网站cookies'
536         cookies_dict = {}
537         # 其他请求头参数
538         headers = {
539              'User-Agent': 'Mozilla/5.0 (Windows NT 6.1; Win64; x64) AppleWebKit/537.36 (KHTML, like Gecko) Chrome/58.0.3029.110 Safari/537.36'
540         }
541         # 访问页面
542         page = requests.get(url=url, cookies=cookies_dict, headers=headers)
543         soup = BeautifulSoup(page.text, 'lxml')
544         all_divs = soup.find_all('div', class_='product_main')
545         travel_divs = [div.get_text() for div in all_divs]
546         num = len(travel_divs)
547         #print(num)
548         Num += num
549         if num < 30:
550             break
551     return Num
552
553 num1 = travelnum('西游记')
554 print("西游记相关景点数量:")
555 print(num1)
556 num2 = travelnum('红楼梦')
557 print("红楼梦相关景点数量:")
558 print(num2)
559 num3= travelnum('水浒传')
560 print("水浒传相关景点数量:")
561 print(num3)
562 num4 = travelnum('三国演义')
563 print("三国演义相关景点数量:")
564 print(num4)
565 content = [num1,num2,num3,num4]
566
567
568
569
570 import matplotlib.pyplot as plt
571 from pylab import mpl#字体
572 #设置字体
573 from matplotlib import mlab
574 from matplotlib import rcParams
575
576 def draw(count):#画柱状图
577     mpl.rcParams['font.sans-serif'] = ['SimHei']
578     plt.title("四大名著相关景点数量")
579     name_list = ['西游记', '红楼梦', '水浒传', '三国演义']
580     #number=[dis1,dis2,dis3,dis4]
581     plt.xlabel("名称")
582     plt.ylabel("景点数量")
583
584     plt.xticks((0,1,2,3),('西游记', '红楼梦', '水浒传', '三国演义'))
585
586     #plt.bar(x = (0,1,2,3),height = distance,width = 0.35,align="center")
587
588     rect = plt.bar(x = (0,1,2,3),height = count,width = 0.35,align="center")
589     rect = plt.bar(x = (0,1,2,3),height = count,width = 0.35,align="center")
590     autolabel(rect)
591
592     plt.show()
593     #print(count)
594     return count
595 draw(content)
596
597
598
599 #分别统计四本书中出现次数最多的二十个词组
600 import os
601 def maxword(book, path):
602     exclude_str = ",。!?、()【】<>《》=:+-*—“”‘’… ;\n了你我她他的\u3000不一来人这儿是下此着个子下上曰之有"   #除去标点符号和无用字符
603     f = open(path,encoding = 'gb18030')
604     content = []
605
606     for line in f:   #将每个词组存储到列表中
607         #line = list(line)
608         for i in range(len(line)-1):    #除去标点符号和无用字符
609             if line[i] not in exclude_str:
610                 if line[i+1] not in exclude_str:
611                     content.append(line[i]+line[i+1])
612
613     count={}  #统计每个字出现的数量
614     for character in content:
615         count.setdefault(character,0)    #如果键不存在于字典中,将会添加键并将值设为默认值
616         count[character] = count[character] + 1
617      # 排序
618     # x[1]是按字频排序,x[0]则是按字排序
619     lstWords = sorted(count.items(), key=lambda x:x[1],  reverse=True)
620     print(book + "中出现频率最高的二十个词组为:")
621     print ('字符\t字频')
622     for e in lstWords[:20]:
623         #print(e)
624         print ('%s\t%d' % e)
625     #print(count)
626     f.close()
627
628 maxword("《红楼梦》", "D:\python\大作业\红楼梦.txt")
629 maxword("《西游记》", r"D:\python\大作业\西游记.txt")
630 maxword("《水浒传》", r"D:\python\大作业\水浒传.txt")
631 maxword("《三国演义》", r"D:\python\大作业\三国演义.txt")
五,总结
经过对主题数据的分析与可视化,可以得到四大名著中的西游记和三国演义更能过受到大众的喜欢和阅读。已经达到预期的目标,成功熟练的使用matplotlib库,在以后的学习和工作生活应用。

 浙公网安备 33010602011771号