matlab 画图
2022-04-05 17:51 jym蒟蒻 阅读(556) 评论(0) 收藏 举报一、实验任务和目的
- 掌握Matlab的句柄图形的继承。
- 掌握Matlab的二、三维画图函数的用法。
- 了解Matlab的特殊二维绘图函数和隐函数绘图的方法。
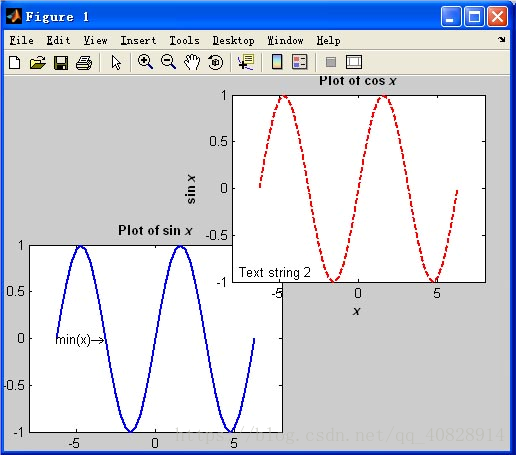
x=-2*pi:pi/100:2*pi;
y=sin(x);

subplot(2,2,2);
plot(x,y,'--k');
title('plot of cos x');
xlabel('x');
ylabel('sinx');
text(-6,-0.8,'Text string 2');
subplot(2,2,3);
plot(x,y);
title('plot of sin x');
text(-2*pi,0,'min(x)->');
代码结果
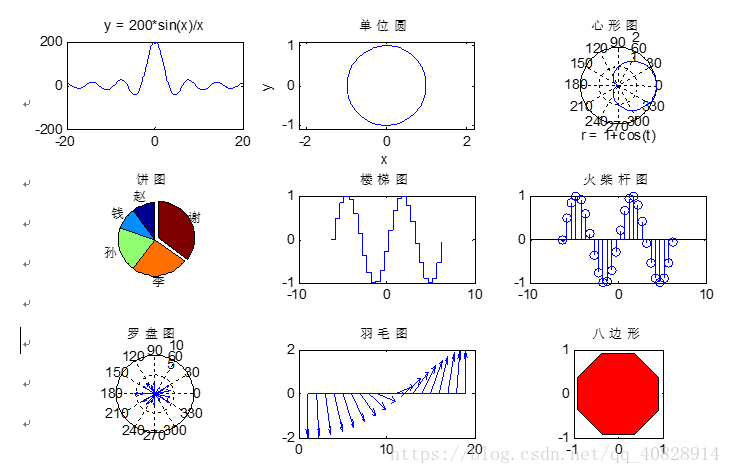
 subplot(3, 3, 1);
 f = @(x)200*sin(x)./x;
 fplot(f, [-20 20]);
 title('y = 200*sin(x)/x');
 subplot(3, 3, 2);
 ezplot('x^2 + y^2 = 1', [-1.1 1.1]);
 axis equal;
 title('单位圆');
 subplot(3, 3, 3);
 ezpolar('1+cos(t)');
 title('心形图');
 subplot(3, 3, 4);
 x = [10  10  20  25  35];
 name = {'赵', '钱', '孙', '李', '谢'};
 explode = [0 0 0 0 1];
 pie(x, explode, name)
 title('饼图');
 subplot(3, 3, 5);
 stairs(-2*pi:0.5:2*pi,sin(-2*pi:0.5:2*pi));
 title('楼梯图');
 subplot(3, 3, 6);
 stem(-2*pi:0.5:2*pi,sin(-2*pi:0.5:2*pi));
 title('火柴杆图');
 subplot(3, 3, 7);
 Z = eig(randn(20,20));
 compass(Z);
 title('罗盘图');
subplot(3, 3, 8);
 theta = (-90:10:90)*pi/180;
 r = 2*ones(size(theta));
 [u,v] = pol2cart(theta,r);
 feather(u,v);
 title('羽毛图');
 subplot(3, 3, 9);
 t = (1/16:1/8:1)'*2*pi;
 fill(sin(t), cos(t),'r');
 axis square;   title('八边形');
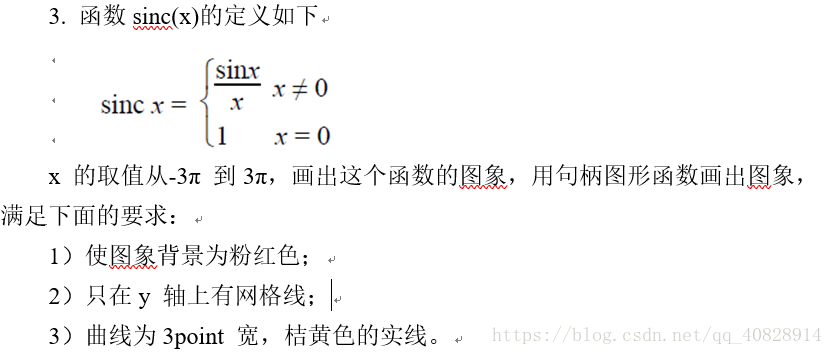
x=-3*pi:0.01:3*pi;
for i=1:length(x)
    if(x(i)==0) y(i)=1;
    else y(i)=sin(x(i))/x(i);
    end
end
plot(x,y);
set(gca,'YGrid','on');
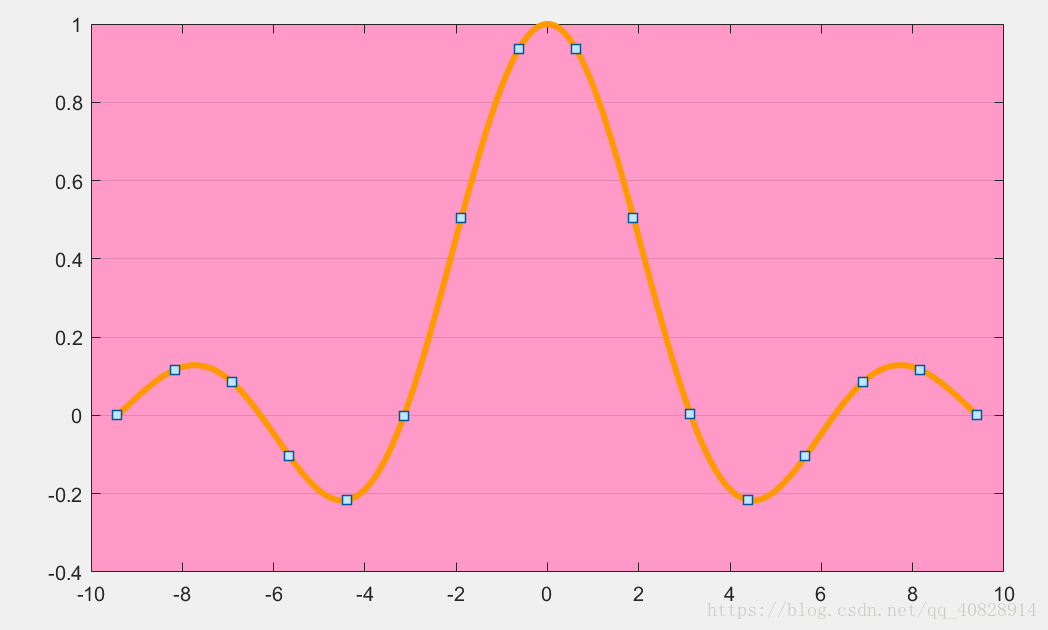
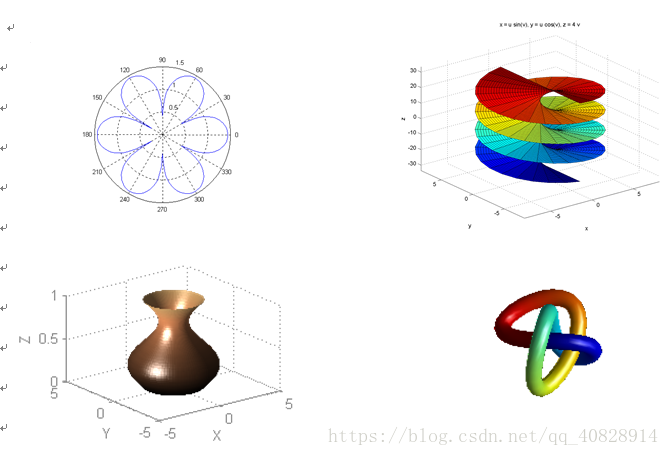
图1:
t = 0 : 0.01 : 2*pi;
polar(t, sin(2*t).*cos(2*t))
图2:
ezsurf('u*sin(v)','u*cos(v)', '4*v',[-2*pi,2*pi,-2*pi,2*pi])
图3:
 t=0:pi/20:2*pi;
 [x,y,z]= cylinder(2+sin(t),100);
 surf(x,y,z);
 xlabel('X'); ylabel('Y'); zlabel('Z');
 set(gca,'color','none');
 shading interp;
 colormap(copper);
 light('Posi',[-4 -1 0]);
 lighting phong;
 material metal;
 hold on;
 %plot3(-4,-1,0,'p','markersize', 18);
% text(-4,-1,0,'光源','fontsize',14,'fontweight','bold'); 
 浙公网安备 33010602011771号