[quality] 01 - gpertools: measure each function
做算法,不懂性能分析,无颜见父老乡亲。
Software optimization resources【非常棒的资源博客,牛的不要不要的】
命令行步骤:
jeff@lolo-id:123$ g++ prof_test.cpp -o output -std=c++11 -lprofiler jeff@lolo-id:123$ LD_PRELOAD=/usr/lib/libprofiler.so CPUPROFILE=p.prof CPUPROFILE_FREQUENCY=1000 ./output 10 PROFILE: interrupts/evictions/bytes = 695/174/8632
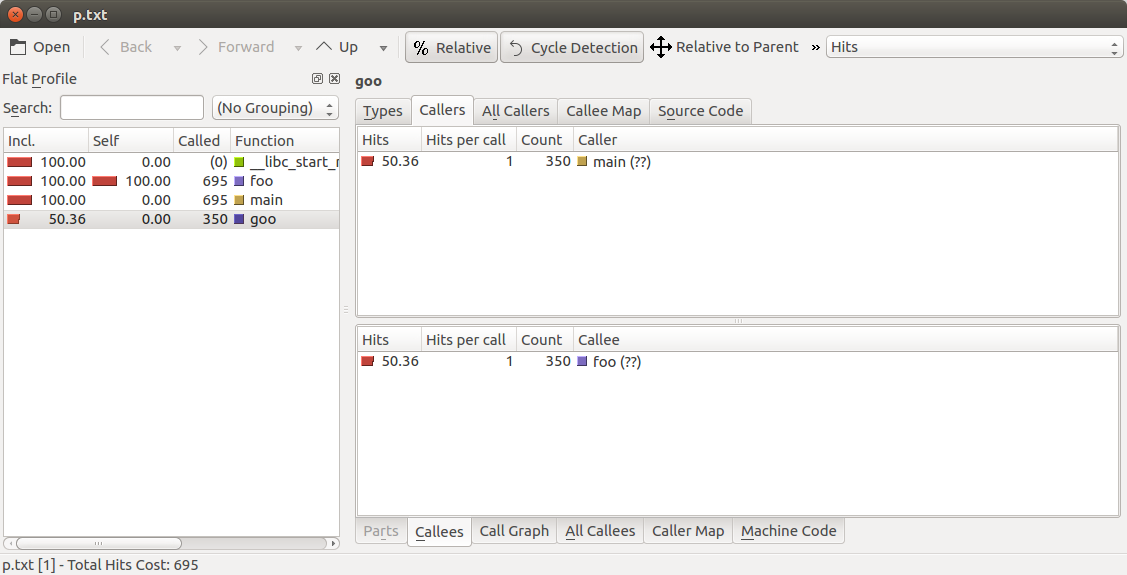
------------------------------------------------------------------------------------------------------------- jeff@lolo-id:123$ pprof --callgrind ./output p.prof > p.txt perl: warning: Setting locale failed. perl: warning: Please check that your locale settings: LANGUAGE = "en_AU:en", LC_ALL = (unset), LANG = "zh_CN.GBK" are supported and installed on your system. perl: warning: Falling back to the standard locale ("C"). Using local file ./output. Using local file p.prof. jeff@lolo-id:123$ kcachegrind p.txt&
-------------------------------------------------------------------------------------------------------------
pprof --pdf ./output p.prof > MyProfile.pdf
# create pdf to show the time cost distribution.
# https://www.ibm.com/developerworks/cn/linux/l-cn-googleperf/index.html
示范代码:
#include<gperftools/profiler.h>
#include<iostream>
#include<string>

void foo(int x){
    while(x>0){
        for(int i=0;i<10000000;++i);
        --x;
    }
}

void goo(int x){
    foo(x);
}

int main(int argc, char* argv[])
{
    int x = 100;
    goo(x);
    ProfilerStart("cpu.profile");
    foo(x);
    ProfilerStop();
    return 0;
}

 浙公网安备 33010602011771号