spring-boot-learning-监控相关
springboot提供了对项目的监控功能,首先我们需要引入需要的jar包:
<!--监控包-->
        <!-- https://mvnrepository.com/artifact/org.springframework.boot/spring-boot-starter-actuator -->
        <dependency>
            <groupId>org.springframework.boot</groupId>
            <artifactId>spring-boot-starter-actuator</artifactId>
<!--            <version>2.3.2.RELEASE</version>-->
        </dependency>

        <!-- https://mvnrepository.com/artifact/org.springframework.hateoas/spring-hateoas -->
<!--        hateoas:Hypermedia as the engine of application state-->
<!--        REST架构风格中复杂的约束,支持springboot http监控端点的需要-->
        <dependency>
            <groupId>org.springframework.hateoas</groupId>
            <artifactId>spring-hateoas</artifactId>
            <version>1.1.1.RELEASE</version>
        </dependency>
spring-boot-starter-actuator 是springboot实施监控所必须的包。
Actuator默认会提供的端点包括下面:
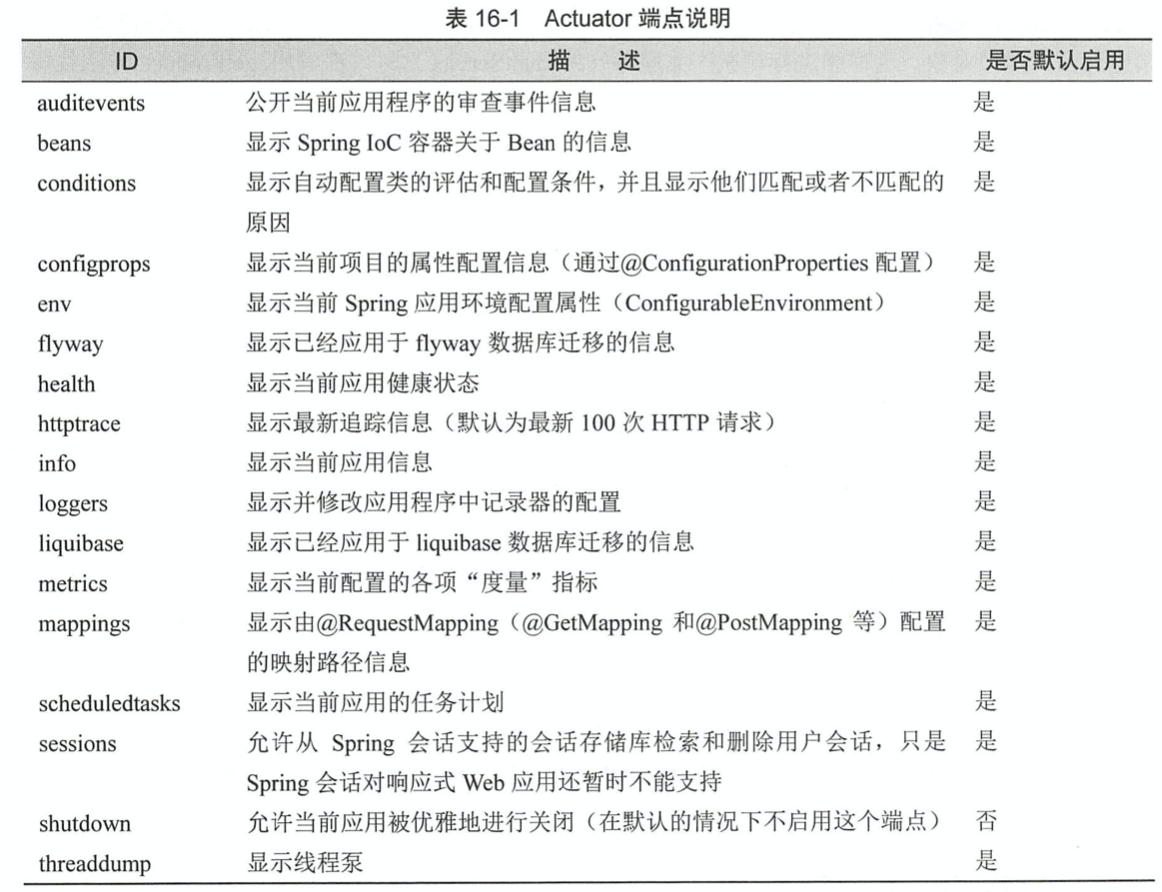
Springboot为这些断电提供多种监控手段,包括http和jmx等。
JMX是什么
JMX(Java Management Extensions,即 Java 管理扩展)是一个为应用程序、设备、系统等植入管理功能的框架。
JMX 可以跨越一系列异构操作系统平台、系统体系结构和网络传输协议,灵活的开发无缝集成的系统、网络和服务管理应用。

JMX 在 Java 编程语言中定义了应用程序以及网络管理和监控的体系结构、设计模式、应用程序接口以及服务。通常使用
JMX 来监控系统的运行状态或管理系统的某些方面,比如清空缓存、重新加载配置文件等。
这里学习的是http
当我们引用的包包括web和actuator的starter包之后,
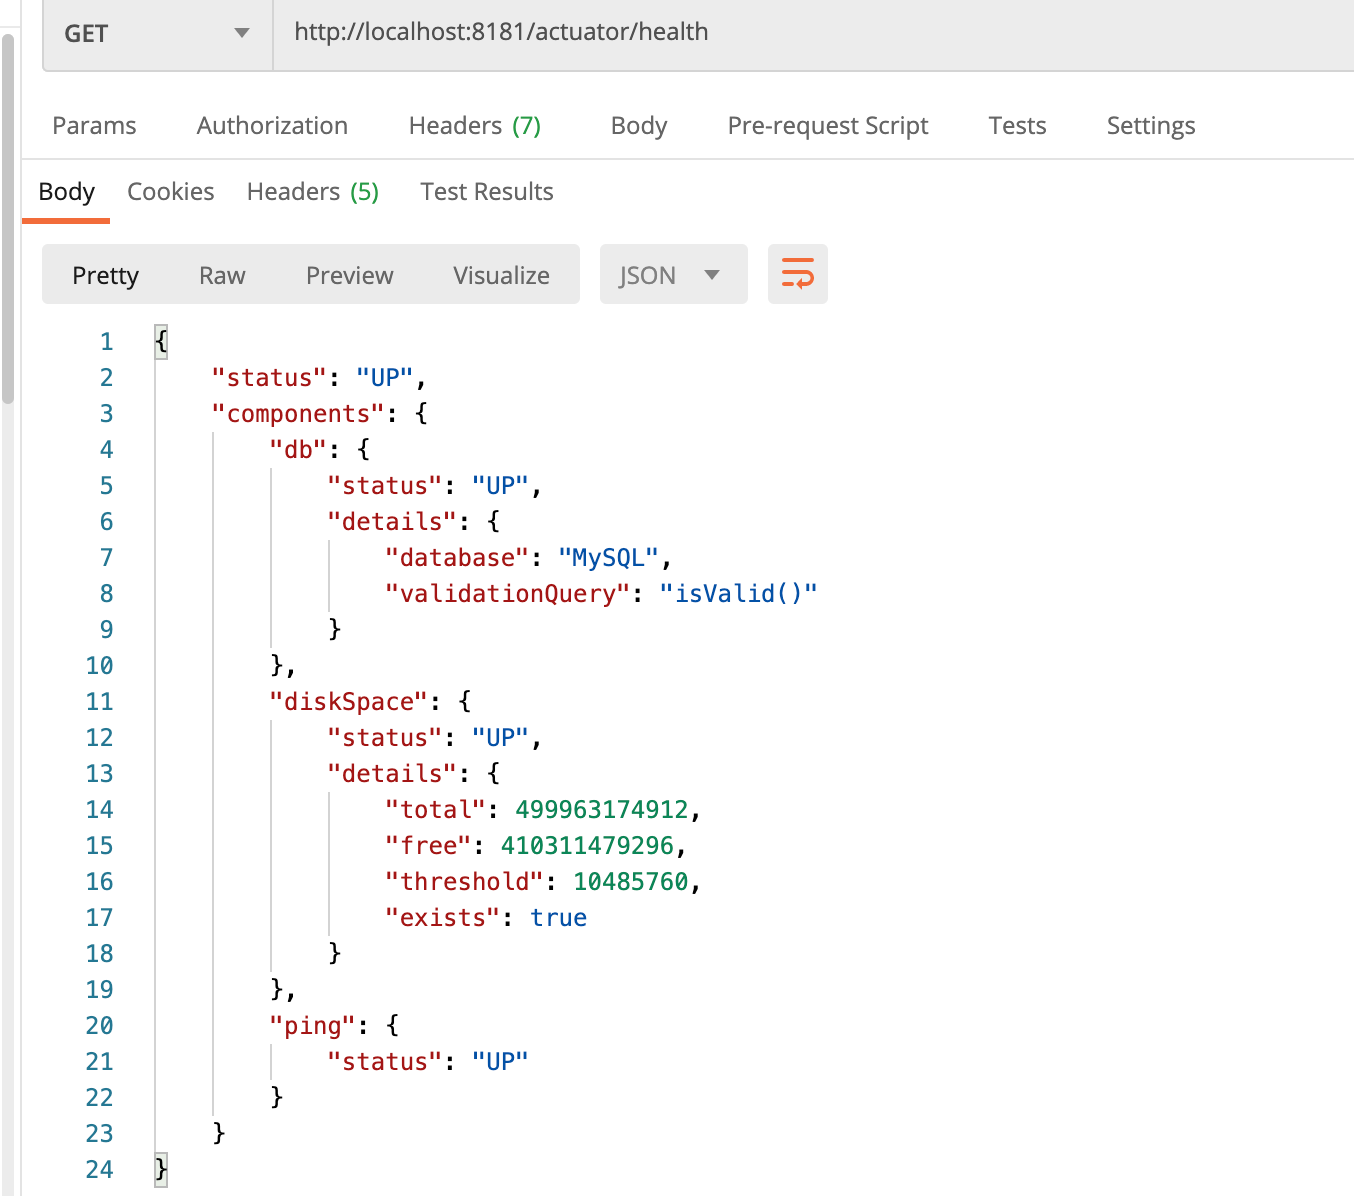
我们启动项目后可以访问:
http://localhost:8181/actuator/health
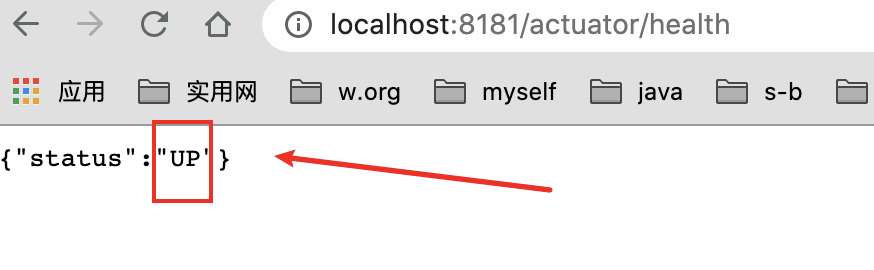
默认只开启了health和info
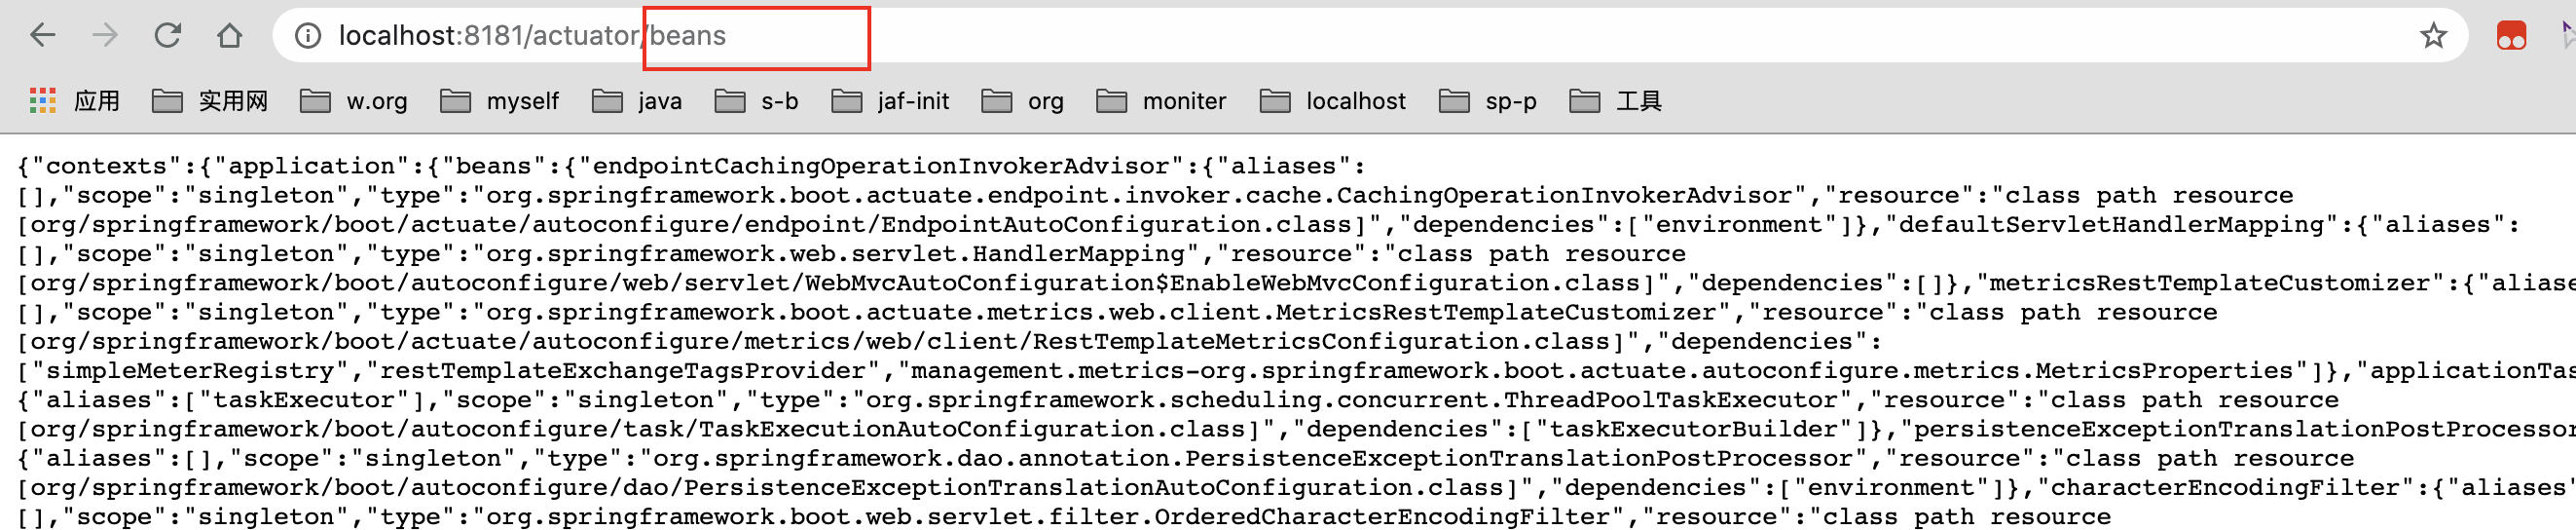
一些端点会显示一些项目的铭感信息,在默认情况下,springboot只会暴露info和health。其余的不暴露,
不过我们可以通过application.properties配置文件可以开启:
management.endpoints.web.exposure.include=info,health,beans
#不暴露env端点
#management.endpoints.web.exposure.exclude=env
#暴露所有端点
#management.endpoints.web.exposure.include=*
集合spring security 限制敏感信息特定人员登录:
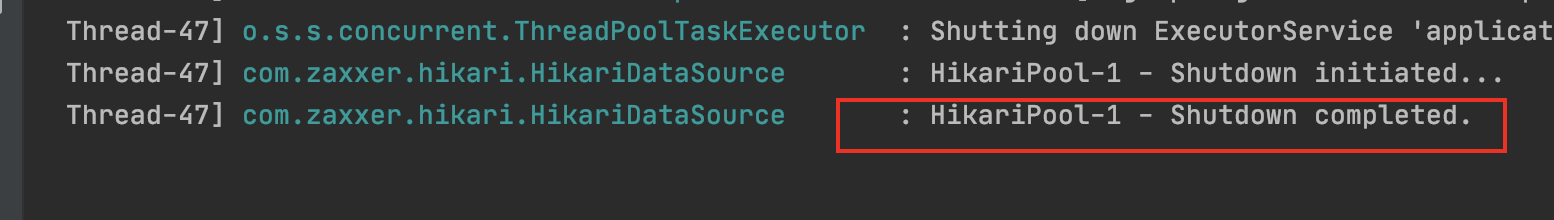
shutdown端点:
。事实上,在默认的情况下, Actuator并不会给开发者启动这个端点, 因为请求它是危险的,从名称就可以知道, 请求它将关闭服务,不过我们可以通过配置文件开启,
#shutdown端点; 直接通过post请求URL关闭服务,
#默认是不会开启的,配置之后可以通过post请求进行访问,直接关闭应用
management.endpoint.shutdown.enabled=true
注意:这个是post请求
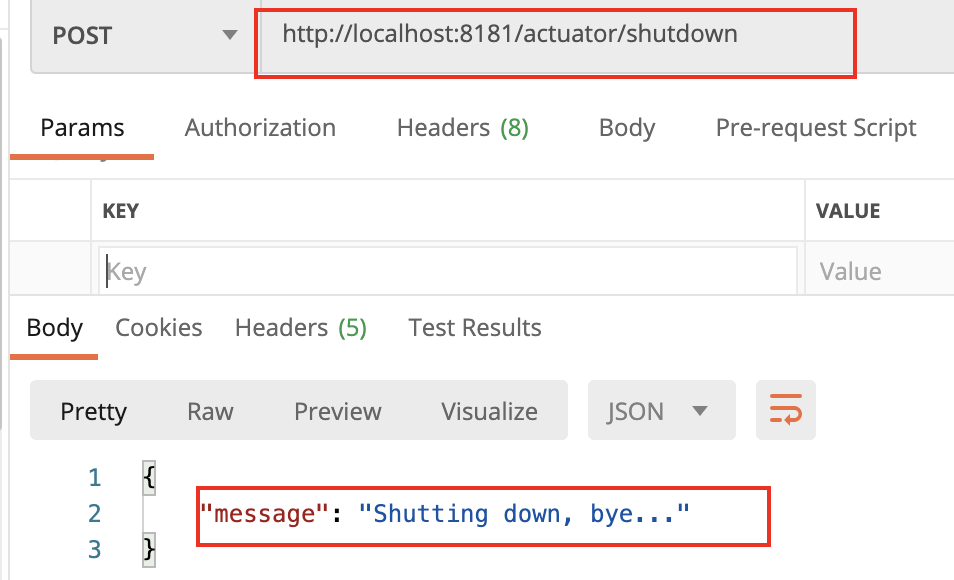
结果
配置端点:
我们可以安装Acuator的默认规则进行使用,也可以自己定义端点的配置:
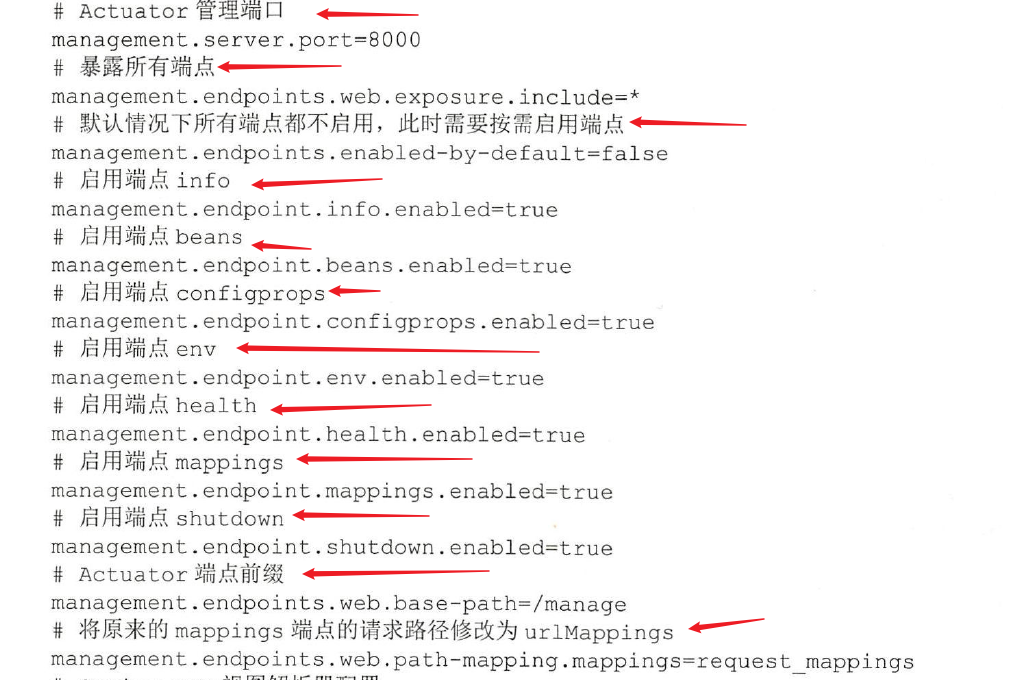
设置了服务器的监控端口为:8000,
通过配置属性management.endpoints.web.base_path=/manage将请求的前缀改为/manage,
所以请求的地址为http://localhost:8000/manage/{endpoint-path}
例如:http://localhost:8000/manage/health

上面设置了不启动任何端点,但是通过下面格式配置可以开启
management.endpoint.<endpointId>.enabled= true

management.endpoints.web.path-mapping.mappings=request_mappings将原来mappings的
端点请求路径从mappings修改为request_mappings
management.endpoints.web.path-mapping.env=/mapping/env将原来env的
端点请求路径从env修改为/mapping/env
自定义端点:
/**
 * 我们可以自定义自己的端点,加入注解@Endpoint,同时提供JMX监控和WEB监控
 * 注意:@JmxEndpoint:只开启JMX监控;@WebEndpoint:只开启web监控
 *
 * 场景:开发一个端点来检测数据是够能够连接上。
 *
 * @Endpoint 定义端点,端点id就是我们的Endpoint的name enableByDefault:默认起不起动端点
 *
 * @ReadOperation 一个端点只能存在一个这个注解去标注方法,代表http的get请求。
 *
 * 最好配置文件加入management.endpoint.dbcheck.enabled=true
 *
 * @ReadOperation == get    成功200  没有返回404
 * @WriteOperation == post  成功200 没有返回值204
 * @DeleteOperation == delete
 */
@Component
@Endpoint(id = "dbcheck",enableByDefault = true)
public class DataBaseConnectionEndPoint {
    private static final String DRIVER = "com.mysql.jc.jdbc.Driver";
    @Value("spring.datasource.url")
    private String url = null;

    @Value("spring.datasource.username")
    private String username= null;

    @Value("spring.datasource.password")
    private String password = null;

    @ReadOperation
    public Map<String,Object> test(){
        Connection connection =null;
        Map<String,Object> msgMap = new HashMap<>();
            try {
                Class.forName(DRIVER);
                connection = DriverManager.getConnection(url,username,password);
                msgMap.put("success",true);
                msgMap.put("message","数据库连接测试");

            } catch (ClassNotFoundException | SQLException e) {
                e.printStackTrace();
            }finally {
                if (connection != null){
                    try {
                        connection.close();
                    } catch (SQLException throwables) {
                        throwables.printStackTrace();
                    }
                }
            }
        return msgMap;
    }

}
配置文件中加入:
management.endpoint.dbcheck.enabled=true
即可启动访问
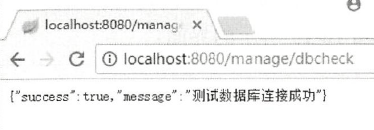
加入的配置就是开启我们自定义的端点dbcheck。
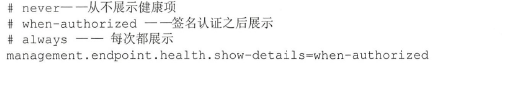
健康指标项
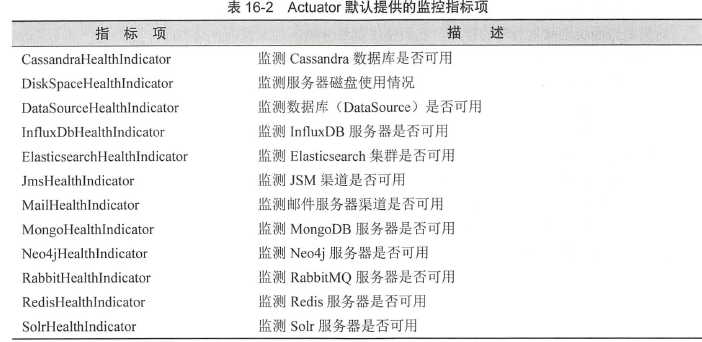
上面的健康指标是Actuator根据我们配置的项目进行自动开启的,只是他们默认请款下,不会进行展示
如果需要展示,需要进行下面配置
这里设置为always后,访问健康检查:
111也可以根据自己的需求区开启或者关闭自己的健康指标:
management.health.db.enabled=false
关闭对数据库的健康指标
222也可以先关闭所有健康检查指标,在开放自己感兴趣的指标
management.health.defaults.enabled=false
management.health.db.enabled=true
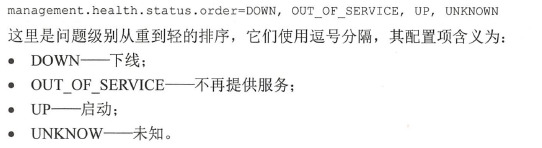
健康指标的严重级别
我们可以自定义自己的健康指标:
场景:现在需要监测服务器是否可以访问万维网( World Wide Web , WWW )
Actuator中的指标设计:

提供作为指标项的接口HealthIndicator,还基于这个接口提供了抽象类AbstractHealthIndicator和指标组合
CompositeHealthIndicator6
@Component
public class WwwHealthIndecator extends AbstractHealthIndicator {
    private final static String BAIDU_HOST = "www.baidu.com";

    private final static int TIME_OUT = 30000;


    @Override
    protected void doHealthCheck(Health.Builder builder) throws Exception {
        boolean status = ping();
        if (status) {
            builder.withDetail("message", "当前服务器可以反问百度").up();
        }else {
            builder.withDetail("message","当前无法访问百度").down();
        }
    }

    private boolean ping() throws Exception{
        try{
            return InetAddress.getByName(BAIDU_HOST).isReachable(TIME_OUT);
        }catch (Exception ex){
            return false;
        }

    }
}
的指标项类标注了@Component ,这样它将被扫描为Spring Bean 。这个指标项继承了
AbstractHealthlndicator,所以需要实现doHealthCheck 方法。doHealthCheck 方法有个Builder 参数,这
个参数的withDetail 方法可以添加一些消息项,还可以根据上下文环境来设置监控状态为“可用”( UP )
或者“不再提供服务” COUT OF SERVICE )。这里,通过监测百度服务器是否可以访问, 来判定万维
网是否可以访问,
结果:


 浙公网安备 33010602011771号