Prometheus(入门)
安装
准备三台服务器
-
Prometheus服务器
-
被监控服务器
-
Grafana服务器(数据转换图形)
配置hosts文件解析
192.168.1.7 prometheus prometheus.itcast.cn
192.168.1.8 agent agent.itcast.cn
192.168.1.9 grafana grafana.itcast.cn
配置主机名
hostnamectl set-hostname prometheus.itcast.cn
hostnamectl set-hostname agent.itcast.cn
hostnamectl set-hostname grafana.itcast.cn
时间同步
mount /dev/sr0 /mnt
yum  -y install ntpdate
ntpdate cn.ntp.org.cn
#解压并安装
[root@prometheus ~]# tar xvf prometheus-2.22.0.linux-amd64.tar.gz -C /usr/local/
[root@prometheus ~]# mv /usr/local/prometheus-2.22.0.linux-amd64/ /usr/local/prometheus
#启动
[root@prometheus prometheus]# cd /usr/local/prometheus
[root@prometheus prometheus]# ./prometheus --config.file="/usr/local/prometheus/prometheus.yml" & (后台启动)
#查看端口:是否启动
[root@prometheus prometheus]# ss -naltp | grep 9090
LISTEN 0 128 [::]:9090 [::]:* users:(("prometheus",pid=12455,fd=9))
默认监控数据:
默认监控图像:可以自定义搜索
使用prometheus监控Linux主机
1、安装node组件
在远程Linux主机(被监控端agent)上安装node_exporter组件
下载地址:https://prometheus.io/download/ 不同的组件监控不同的服务。
上传软件包
解压并安装
[root@agent ~]# tar xvf node_exporter-1.0.1.linux-amd64.tar.gz -C /usr/local/
[root@agent ~]# mv /usr/local/node_exporter-1.0.1.linux-amd64/ /usr/local/node_exporter
启动node_exporter组件
[root@agent ~]# nohup /usr/local/node_exporter/node_exporter &
查看端口占用情况
[root@agent ~]# ss -anltp | grep 9100
LISTEN     0      128       [::]:9100                  [::]:*                   users:(("node_exporter",pid=12411,fd=3))
查看搜集的信息:http://被监控端ip:9100/metrics
prometheus拉取node节点信息
在prometheus服务器的配置文件中添加被监控机器的配置段:/usr/local/prometheus/prometheus.yml
#vim /usr/local/prometheus/prometheus.yml
在文件最后添加:
  - job_name: 'agent'
    static_configs:
    - targets: ['192.168.1.8:9100']
重启prometheus
[root@prometheus prometheus]# pkill prometheus
[root@prometheus prometheus]# ss -anltp | grep 9090
[root@prometheus prometheus]# /usr/local/prometheus/prometheus  --config.file="/usr/local/prometheus/prometheus.yml" &
[root@prometheus prometheus]# ss -anltp | grep 9090
查看监控界面:
监控远程mysql
在被监控端agent上安装mysqld_exporter组件
安装mysqld_exporter组件
# tar xvf mysqld_exporter-0.12.1.linux-amd64.tar.gz -C /usr/local/
# mv /usr/local/mysqld_exporter-0.12.1.linux-amd64/ /usr/local/mysqld_exporter
root@agent ~]# cd /usr/local/mysqld_exporter
[root@agent mysqld_exporter]# ls
LICENSE mysqld_exporter NOTICE
安装mariadb数据库
[root@agent ~]# yum -y install mariadb\*
[root@agent ~]# systemctl start  mariadb
[root@agent ~]# systemctl enable  mariadb
[root@agent ~]# ss -anltp | grep 3306
LISTEN     0      50           *:3306                     *:*                   users:(("mysqld",pid=12877,fd=14))
创建MySQL账号:
[root@agent ~]# mysql
MariaDB [(none)]> grant select,replication client,process ON *.* to 'mysql_monitor'@'localhost' identified by '123';
MariaDB [(none)]> flush privileges;
exit
创建一个mariadb配置文件,写上连接的用户名与密码(he上边授权的用户名及密码要一致)
[root@agent ~]# vim /usr/local/mysqld_exporter/.my.conf =》手动创建
[client]
user=mysql_monitor
password=123
启动mysql_exporter
[root@agent ~]# nohup /usr/local/mysqld_exporter/mysqld_exporter --config.my-cnf=/usr/local/mysqld_exporter/.my.conf &
[root@agent ~]# ss -anltp | grep 9104
LISTEN     0      128       [::]:9104                  [::]:*                   users:(("mysqld_exporter",pid=13033,fd=3))
配置prometheus服务器的配置文件添加被监控的mariadb的配置:
vim  /usr/local/prometheus/prometheus.yml
  - job_name: 'agent1_mariadb'
    static_configs:
    - targets: ['192.168.1.8:9104']

改完后重启服务;
[root@prometheus prometheus]# pkill prometheus
[root@prometheus prometheus]# ss -anltp | grep 9090
[root@prometheus prometheus]# /usr/local/prometheus/prometheus  --config.file="/usr/local/prometheus/prometheus.yml" &
[root@prometheus prometheus]# ss -anltp | grep 9090
查看刷新监控界面
Grafana可视化图形工具
使用Grafana连接prometheus
在Grafana服务器上安装Grafana
下载地址:https://grafana.com/grafana/download
[root@agent ~]# yum install grafana-7.3.0~beta1-1.x86_64.rpm -y
[root@agent ~]# wget https://dl.grafana.com/oss/release/grafana-7.3.0~beta1-1.x86_64.rpm
[root@agent ~]# rpm -ivh grafana-7.3.0~beta1-1.x86_64.rpm
[root@agent ~]# systemctl start grafana-server
[root@agent ~]# systemctl enable grafana-server
Created symlink from /etc/systemd/system/multi-user.target.wants/grafana-server.service to /usr/lib/systemd/system/grafana-server.service.
[root@agent ~]# ss -anltp |grep 3000
LISTEN     0      128       [::]:3000                  [::]:*                   users:(("grafana-server",pid=21310,fd=9))
登录Grafana :192.168.1.8:3000
默认用户名密码都是admin
添加prometheus的数据源
设置数据源名称 类型 ip 端口。。
查看:
Grafana图形显示MySQL监控数据
修改配置文件安装模板
在Grafana上修改配置文件,并下载安装mysql监控的dashboard(包含相关json文件,这些json文件可以看作是开发人员的一个监控模板)
[root@agent ~]# vim /etc/grafana/grafana.ini
[dashboard.json]
enabled = true
path = /var/lib/grafana/dashboards
[root@agent grafana]# git clone https://github.com/percona/grafana-dashboards.git
发现git太慢了 https://github.com/percona/grafana-dashboards 直接去下载到本地。上传到服务器。
[root@agent dashboards]# pwd
/var/lib/grafana/dashboards
[root@agent dashboards]# systemctl restart grafana-server
在Grafana中导入json文件
上传MySQL Overview.json文件,设置完成后单击import。
Grafana+onealert报警
AppKey: 32c28c87-a370-461d-8117-aa8522f56874
配置步骤
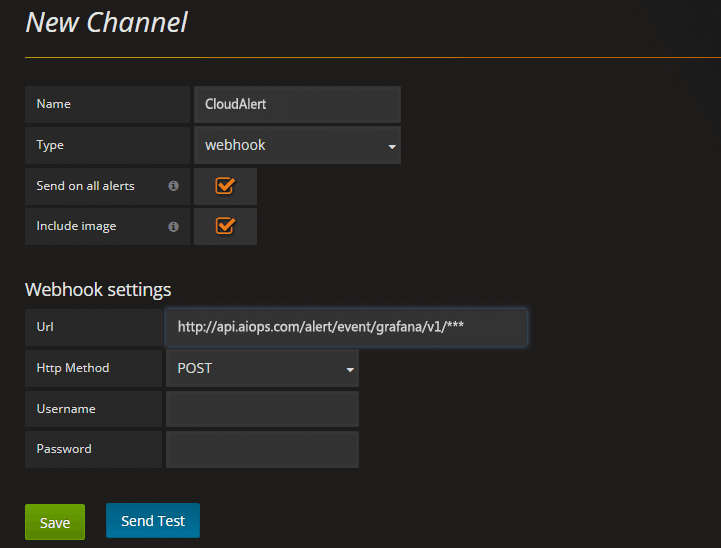
一、在Grafana中配置Webhook URL
1、在Grafana中创建Notification channel,选择类型为Webhook;
2、推荐选中Send on all alerts和Include image,Cloud Alert体验更佳;
3、将第一步中生成的Webhook URL填入Webhook settings Url;
URL格式: http://api.aiops.com/alert/api/event/grafana/v1/32c28c87-a370-461d-8117-aa8522f56874/
4、Http Method选择POST;
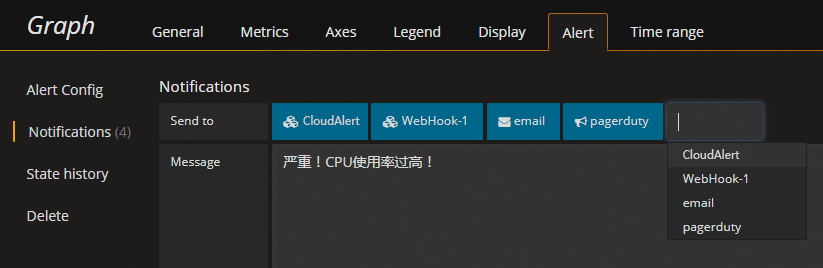
二、将配置的Webhook Notification Channel添加到Grafana Alert中
测试:
[root@agent dashboards]# cat /dev/urandom | md5sum

 浙公网安备 33010602011771号