1 from pyecharts.charts import Bar,Line
2 from pyecharts import options as opts
3
4 #x_data = ["婴幼儿(0到6岁)", "少儿(7到12岁)", "青少年(13到17岁)", "青年(18到45岁)", "中年(46到60岁)", "老年(60岁以上)"]
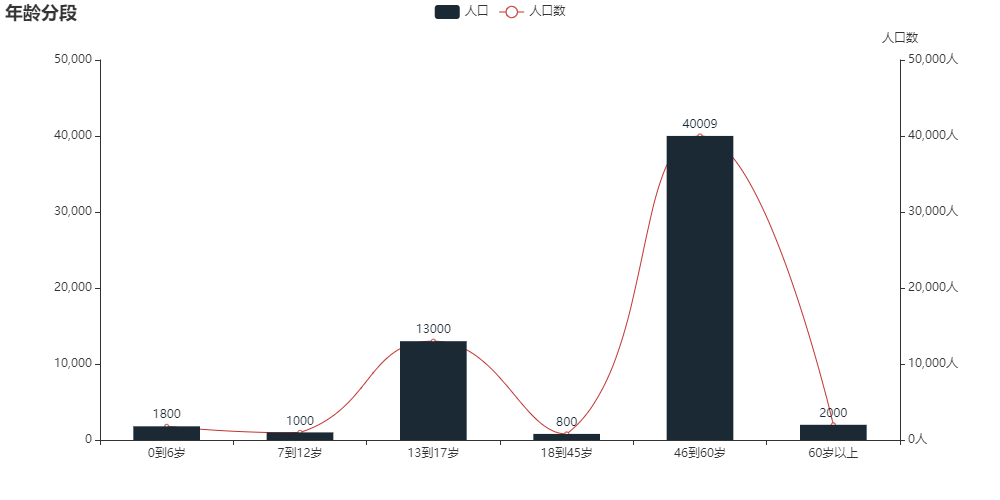
5 x_data = ["0到6岁", "7到12岁", "13到17岁", "18到45岁", "46到60岁", "60岁以上"]
6
7 y_data = [1800, 1000, 13000, 800, 40009, 2000]
8 def bar_charts()->Bar:
9 bar1 = (
10 Bar(init_opts=opts.InitOpts(width='1000px',height='500px')) # 示例对象
11 .add_xaxis(x_data) # x轴数据
12 .add_yaxis("人口",y_data,color='#1a2933',category_gap="50%" ) # 图例名称 + y轴数据+颜色+图间隔
13 #.add_yaxis("商家B",B)
14 # 全局配置:标题/副标题
15 .set_global_opts(title_opts=opts.TitleOpts(title="年龄分段"),
16 #tooltip_opts=opts.TooltipOpts(trigger='axis',axis_pointer_type='cross'), # 指示器类型,十字/阴影/直线/无
17 #toolbox_opts=opts.ToolboxOpts(
18 #is_show = True, )
19 )
20
21 # bar 拓展
22 .extend_axis(
23 yaxis=opts.AxisOpts( # 右侧y轴标签
24 name='人口数',
25 type_='value', # 类型
26 min_=0,
27 max_=50000,
28 interval=10000, # 间隔
29 axislabel_opts=opts.LabelOpts(formatter='{value}人') # 标签显示
30
31 )
32 )
33 )
34
35 return bar1
36
37
38 def line_charts()->Line():
39 line1=(
40 Line()
41 .add_xaxis(x_data)
42 .add_yaxis('人口数',y_data,yaxis_index=1, # 线图用右侧索引,因此为1
43 label_opts=opts.LabelOpts(is_show=False),is_smooth=True)
44 )
45 return line1
46
47 bar1=bar_charts()
48 line1=line_charts()
49
50 # line1.render_notebook()
51 bar1.overlap(line1).render_notebook()
![]()


 浙公网安备 33010602011771号