4. Prometheus 部署
常见的部署 Prometheus 方式有两种:一种是使用二进制部署,另一种则是更简单的 docker 部署
二进制部署
二进制部署方式详情可以在 prometheus 的官网中查看到,其地址为:https://prometheus.io/docs/prometheus/latest/getting_started/
安装步骤
下载 prometheus 压缩文件
在 https://prometheus.io/download/ 下载对应系统最新的 prometheus 压缩文件。目前最新的 prometheus 版本为 3.0.0-rc.0

在这里下载 linux 操作系统的 prometheus
解压文件
解压文件,并进入 prometheus 目录。
tar -zxvf prometheus-3.0.0-rc.0.linux-amd64.tar.gz

cd prometheus-3.0.0-rc.0.linux-amd64
配置 Prometheus
在解压的目录中有一个默认的 prometheus.yml 配置文件。可以根据需要编辑该文件,定义要监控的服务和目标。
global:
  scrape_interval: 15s  # 设置抓取频率

scrape_configs:
  - job_name: 'prometheus'
    static_configs:
      - targets: ['localhost:9090']
  - job_name: 'springboot-app'
    metrics_path: '/actuator/prometheus'
    static_configs:
      - targets: ['172.31.224.1:8081']
- 在 scrape_configs 中默认会提供监控 prometheus 的配置。除此之外,我们还需要监控自己的 spring boot 应用,则在 scrape_configs 中加上相应的配置。prometheus 默认使用
target +/metrics来访问度量数据,由于 spring boot 暴露 prometheus 的端口是/actuator/prometheus,则需要在 metrics_path 中指定。
运行 Prometheus
配置完毕后,使用以下命令启动 Prometheus:
./prometheus --config.file=prometheus.yml
如果需要 prometheus 在后台运行,可以使用 nohup 或者 systemd 来管理。
访问 Prometheus UI
启动 Prometheus 成功后,可通过 http://localhost:9090/target 查看 prometheus 监控的目标以及目标的状态。
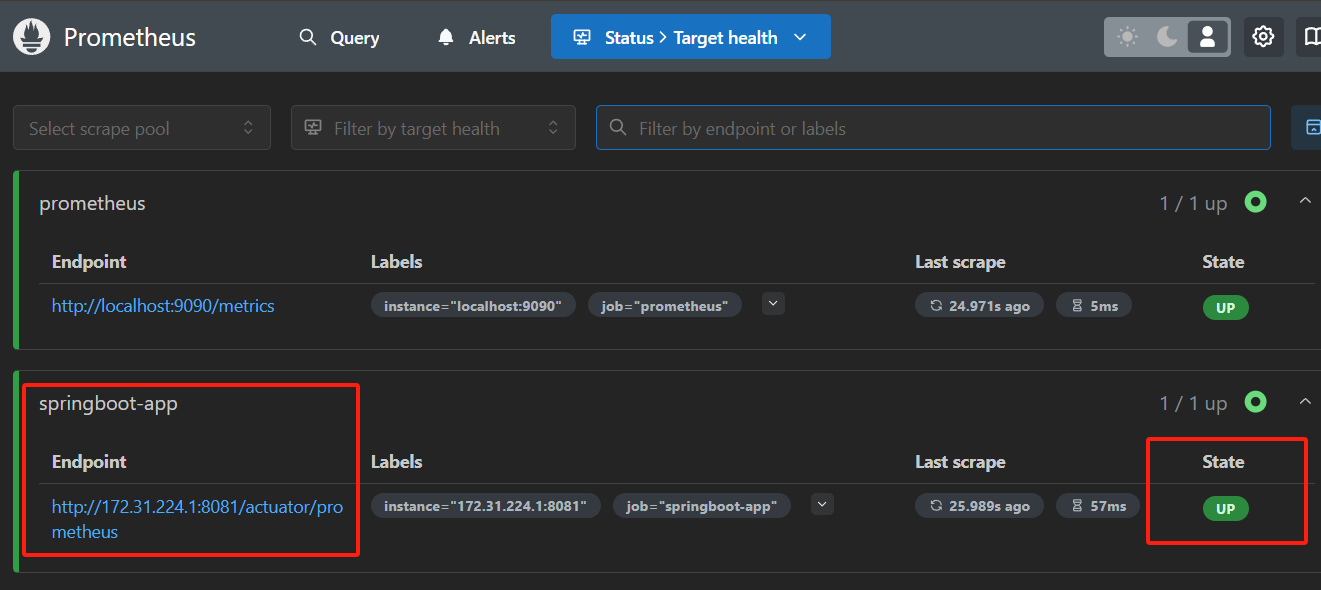
- 可以看到 springboot-app 的状态为 up,说明 prometheus 可以监控到配置的 springboot 应用。
查询示例
在 Query 中查询 springboot-app 的内存使用情况,可以使用 jvm_memory_used_bytes{job="springboot-app"} 查询

Docker 部署
docker 部署方式详情可以在 prometheus 的官网中查看到,其地址为:https://prometheus.io/docs/prometheus/latest/installation/
安装步骤
使用 docker 部署只需要在当前目录下创建 prometheus.yml 文件,然后 docker run 命令启动 proemtheus 服务
docker run \
    -p 9090:9090 \
    -v /path/to/prometheus.yml:/etc/prometheus/prometheus.yml \
    prom/prometheus
如果需要将 prometheus 数据保存到宿主机,则使用如下命令:
docker run \
    -p 9090:9090 \
    -v /path/to/prometheus.yml:/etc/prometheus/prometheus.yml \
    -v prometheus-data:/prometheus \
    prom/prometheus

 浙公网安备 33010602011771号