R语言实战学习笔记-R语言绘图基础
本文将从以下几个方面介绍R语言绘图基础:1.简单实例 2.图形参数 3.添加文本、自定义坐标轴和图例 4.图形的组合
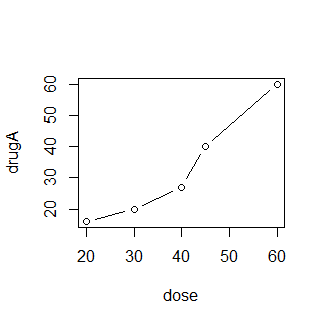
1.简单实例
#绘制第一个图形
dose<-c(20,30,40,45,60)
drugA<-c(16,20,27,40,60
plot(dose,drugA,type="b")
2.图形参数
图形中常用的参数:
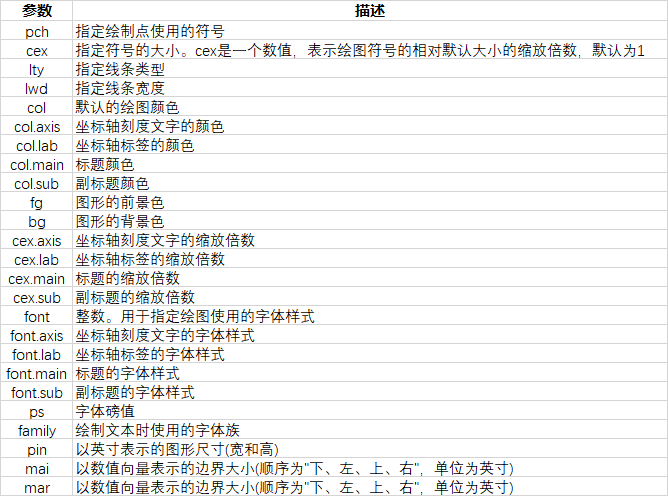
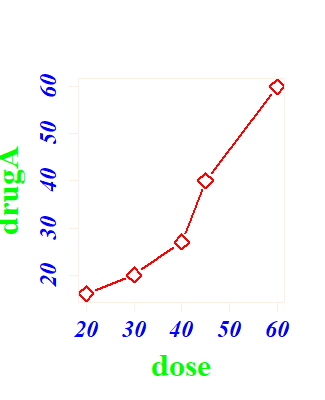
以下为运用以上参数绘制图形的实例:
#绘制图形
dose<-c(20,30,40,45,60)
drugA<-c(16,20,27,40,60)
drugB<-c(15,18,25,31,40)
plot(dose,drugA,pch=5,type="b",cex=1.5,lty=1,lwd=2,col="red",                               #设置线型
col.axis="blue",col.lab="green",col.main="pink",col.sub="orange",fg="linen",bg="SeaGreen1", #设置颜色
cex.axis=1.5,cex.lab=2,cex.main=2,cex.sub=1.5,                                              #设置标签缩放倍数
font.axis=2,font.lab=1,font.main=4,font.sub=2,ps=2,family="serif",                          #设置标签的字体样式
pin=c(2,1),mai=c(1,0.5,2,0.2))                                                              #设置图形的尺寸
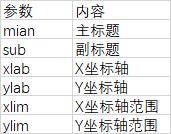
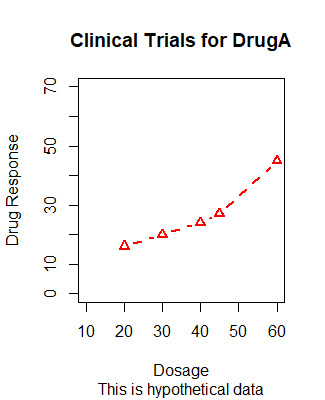
3.图形的标题、坐标轴信息添加
#图形实例
dose<-c(20,30,40,45,60)
drugA<-c(16,20,24,27,45)
plot(dose,drugA,type="b",
col="red",lty=2,pch=2,lwd=2,
main="Clinical Trials for DrugA",
sub="This is hypothetical data",
xlab="Dosage",ylab="Drug Response",
xlim=c(10,60),ylim=c(0,70))
3.1自定义标题和坐标轴
#添加自定义标题和坐标轴
title(main="main title",sub="subtitle",xlab="x-axis",ylab="y-axis label"
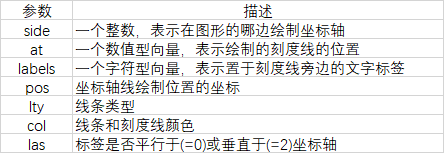
axis(side,at=,labels=,pos=,lty=,col=,las=,tck=,……)
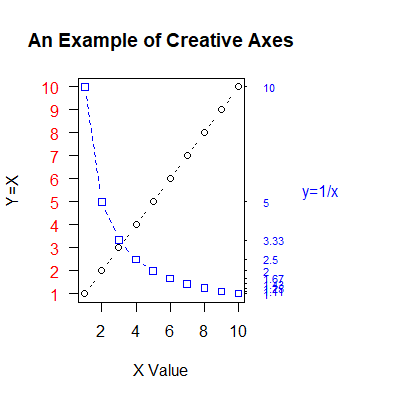
#自定义坐标轴
x<-c(1:10)
y<-x
z<-10/x
opar<-par(no.readonly=TRUE)
par(mar=c(5,4,4,8)+0.1)                                   #增加边界大小
plot(x,y,type="b",pch=21,yaxt="n",lty=3,ann=FALSE)        #绘制x对y的图形
lines(x,z,type="b",pch=22,col="blue",lty=2)               #绘制x对1/x的线
axis(2,at=x,labels=x,col.axis="red",las=2)                #绘制针对y=x自定义坐标轴
axis(4,at=z,labels=round(z,digits=2),col.axis="blue",las=2,cex.axis=0.7,tck=-0.01) #绘制针对y=1/x的坐标轴
mtext("y=1/x",side=4,line=3,cex.lab=1,las=2,col="blue")   #添加标题
title("An Example of Creative Axes",
      xlab="X Value",
      ylab="Y=X")
par(opar)
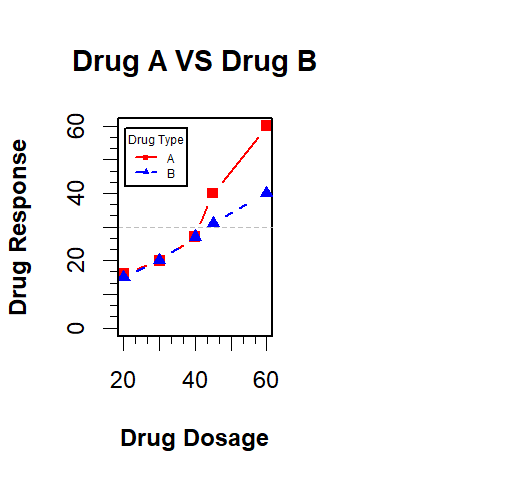
3.2添加参考线、图例
#绘制图例
dose<-c(20,30,40,45,60)
drugA<-c(16,20,27,40,60)
drugB<-c(15,20,27,31,40)
opar<-par(no.readonly=TRUE)
par(lwd=2,cex=1.5,font.lab=2)
plot(dose,drugA,type="b",pch=15,lty=1,col="red",ylim=c(0,60),main="Drug A VS Drug B",xlab="Drug Dosage",ylab="Drug Response")
lines(dose,drugB,type="b",pch=17,lty=2,col="blue")
abline(h=c(30),lwd=1.5,lty=2,col="gray")
library(Hmisc)
minor.tick(nx=3,ny=3,tick.ratio=0.5)
legend("topleft",cex=0.5,inset=0.05,title="Drug Type",c("A","B"),lty=c(1,2),pch=c(15,17),col=c("red","blue"))#添加图例
par(opar)
3.2添加文本
#添加文本
attach(mtcars)
plot(wt,mpg,main="Mileage vs Car Weight",
     xlab="Weight",ylab="Mileage",
     pch=18,col="blue")
text(wt,mpg,row.names(mtcars),cex=0.6,pos=4,col="red")#添加标签
detach(mtcars)

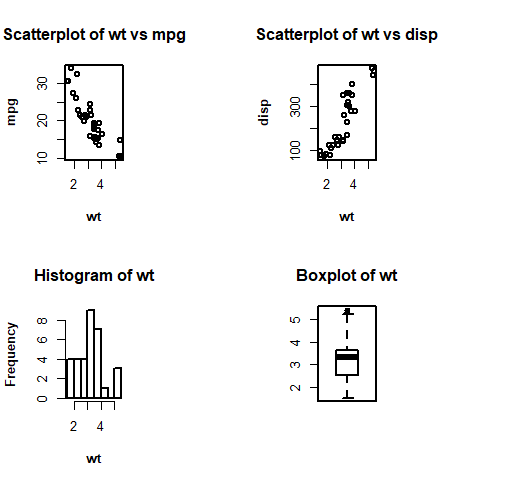
4.图形的组合
#图形组合,
attach(mtcars)
opar<-par(no.readonly=TRUE)
par(mfrow=c(2,2))#绘制2*2四个图形区域
plot(wt,mpg,main="Scatterplot of wt vs mpg")
plot(wt,disp,main="Scatterplot of wt vs disp")
hist(wt,main="Histogram of wt")
boxplot(wt,main="Boxplot of wt")
par(opar)
detach(mtcars)
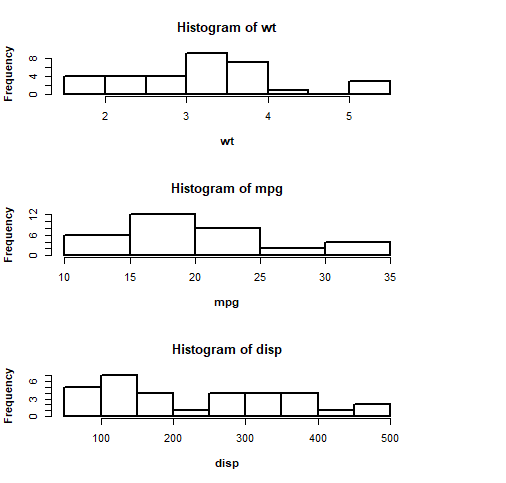
#创建3*1的图形组合
attach(mtcars)
opar<-par(no.readonly=TRUE)
par(mfrow=c(3,1))
hist(wt)
hist(mpg)
hist(disp)
par(opar)
detach(mtcars)
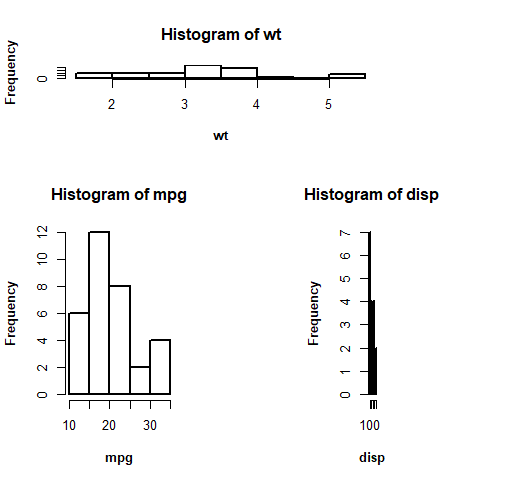
#精确控制图形布局大小
attach(mtcars)
layout(matrix(c(1,1,2,3),2,2,byrow=TRUE),widths=c(1.5,1),heights=c(1,2))#第二行中左边图形的宽度是右边的1.5倍,第二行的图形高度是第一行的2倍
hist(wt)
hist(mpg)
hist(disp)
detach(mtcars)
以上为R语言中图形中的基本信息,后续针对学习基本图形的画法。

 浙公网安备 33010602011771号