echarts散点图区域设置
示例一:效果图
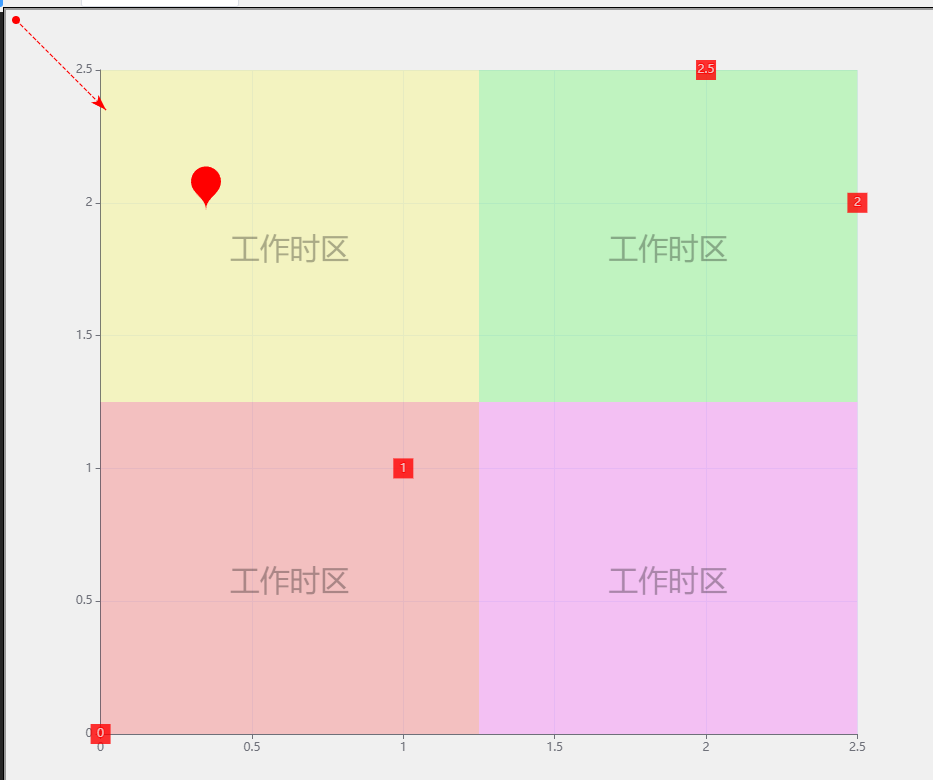
示例一:代码
option = {
    titile: {
        text: '散点图',
    },
    xAxis: {},
    yAxis: {},
    tooltip: {
        show: true,
    },
    series: [
        {
            type: 'scatter',
            symbolSize: 20,
            symbol: 'rect',
            label: {
                show: true,
            },
            itemStyle: {
                color: 'red',
            },
            markPoint: {
                label: {
                    show: true,
                },
                data: [
                    {
                        name: 'www',
                        x: 200,
                        y: 200,
                    },
                ],
            },
            markLine: {
                data: [
                    [
                        {
                            x: 10,
                            y: 10,
                        },
                        {
                            x: 100,
                            y: 100,
                        },
                    ],
                ],
            },
            markArea: {
                silent:true,
                label:{
                    position:['50%','50%'],
                    align:'center',
                    color:'rgba(0,0,0,0.3)',
                    fontSize:30
                },
                itemStyle:{
                    color:'rgba(0,0,0,0.1)'
                },
                data: [
                    // [
                    //     {
                    //         name:"工作时区",
                    //         x: '0',
                    //         value:'1'
                    //     },
                    //     {
                    //         x: '20%',
                    //         value:'1'
                    //     },
                    // ],
                     [
                        {
                            name:"工作时区",
                            coord:[1.25,1.25],
                            itemStyle:{
                                color:'rgba(255,0,0,0.2)'
                            }

                        },
                        {
                            coord:[0,0],
                        },
                    ],
                    [
                        {
                            name:"工作时区",
                            coord:[1.25,1.25],
                            itemStyle:{
                                color:'rgba(255,0,255,0.2)'
                            }

                        },
                        {
                            coord:[2.5,0],
                        },
                    ],
                    [
                        {
                            name:"工作时区",
                            coord:[1.25,1.25],
                            itemStyle:{
                                color:'rgba(255,255,0,0.2)'
                            }

                        },
                        {
                            coord:[0,2.5],
                        },
                    ],
                    [
                        {
                            name:"工作时区",
                            coord:[1.25,1.25],
                            itemStyle:{
                                color:'rgba(0,255,0,0.2)'
                            }

                        },
                        {
                            coord:[2.5,2.5],
                        },
                    ]

                ],
            },
            data: [
                [0, 0],
                [1, 1],
                [2.5, 2],
                [2, 2.5],
            ],
        },
    ],
};
示例2:效果图
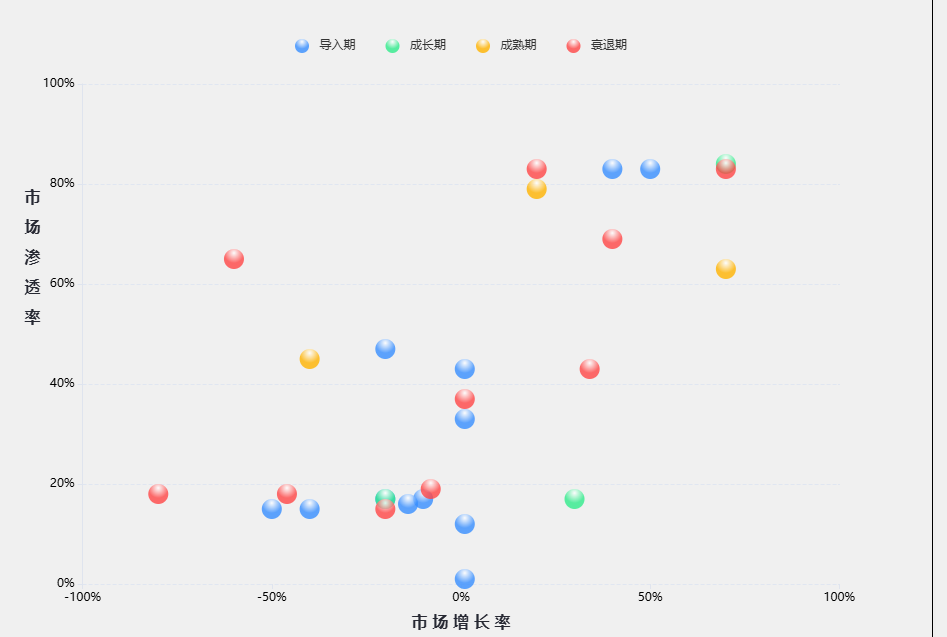
示例2:代码
//气泡图
//暂时的假数据
const className = ['导入期', '成长期', '成熟期', '衰退期'];
const colorList = ['#378eff', '#31eb8b', '#ffb300', '#ff4646'];
var data1 = [
    [
        [1, 1, '产品1'],
        [1, 12, '产品2'],
        [-50, 15, '产品5'],
        [50, 83, '产品5'],
        [-20, 17, '产品5'],
        [-10, 17, '产品5'],
        [1, 33, '产品5'],
        [1, 43, '产品5'],
        [-40, 15, '产品5'],
        [40, 83, '产品5'],
        [-20, 47, '产品5'],
        [-14, 16, '产品5'],
    ],
    [[30, 17, '产品5'], [10, 20, '产品2'][(13, 25, '产品5')], [-20, 17, '产品5'], [70, 84, '产品5']],
    [
        [20, 79, '产品5'],
        [-40, 45, '产品5'],
        [70, 63, '产品5'],
    ],
    [
        [40, 69, '产品5'],
        [-20, 15, '产品5'],
        [20, 83, '产品5'],
        [-60, 65, '产品5'],
        [70, 83, '产品5'],
        [-80, 18, '产品5'],
        [-8, 19, '产品5'],
        [1, 37, '产品5'],
        [34, 43, '产品5'],
        [-46, 18, '产品5'],
    ],
];
const series = [];
className.forEach((item, index) => {
    series.push({
        name: item,
        data: data1[index],
        type: 'scatter',
        symbolSize: 20,
        itemStyle: {
            normal: {
                shadowBlur: 0,
                shadowOffsetY: 0,
                color: new echarts.graphic.RadialGradient(0.5, 0.2, 0.5, [
                    {
                        offset: 0,
                        color: '#fff',
                    },
                    {
                        offset: 1,
                        color: colorList[index],
                    },
                ]),
            },
        },
    });
});
//气泡图的配置项
option = {
    grid: {
        left: '10%',
        right: '10',
        height: 500,
        width: '80%',
        top: '100',
        //   containLabel: true
    },
    legend: {
        show: true,
        top: 50,
        itemGap: 30, // 垂直间距
        y: 'top', // 延Y轴居中
        data: className,
    },
    tooltip: {
        trigger: 'item',
        axisPointer: {
            type: 'none',
        },
        formatter: function (params) {
            let str = '<div style="text-align: left;"><div style="color:#8994a5;">' + params.data[2] + '</div>';
            str += '<div>周期:' + params.seriesName + '</div>';
            str += '<div>市场渗透率:' + params.data[1] + '%</div>';
            str += '<div>市场增长率:' + params.data[0] + '%</div></div>';
            return str;
        },
    },
    xAxis: {
        show: true,
        min: -100,
        max: 100,
        name: '市 场 增 长 率',
        nameLocation: 'middle',

        nameTextStyle: {
            color: '#272933',
            fontSize: 16,
            fontWeight: 'bold',
            lineHeight: 30,
            padding: [10, 0, 0, 0],
        },
        splitLine: {
            show: false,
            lineStyle: {
                type: 'dashed',
            },
        },
        axisLine: {
            show: false,
            lineStyle: {
                color: '#dfe4ee',
                width: 0,
            },
        },
        axisLabel: {
            color: '#000',
            formatter: '{value}%',
        },
    },
    yAxis: {
        show: true,
        name: '市\n场\n渗\n透\n率',
        nameLocation: 'letf',
        nameTextStyle: {
            color: '#272933',
            fontSize: 16,
            fontWeight: 'bold',
            lineHeight: 30,
            padding: [0, 100, 0, 0],
        },
        splitLine: {
            lineStyle: {
                type: 'dashed',
            },
        },
        axisLine: {
            onZero: false,
            lineStyle: {
                color: '#dfe4ee',
                width: 1,
            },
        },
        axisLabel: {
            color: '#000',
            formatter: '{value}%',
        },
        scale: true,
    },
    series: series,
};

 浙公网安备 33010602011771号