Echart基本案例
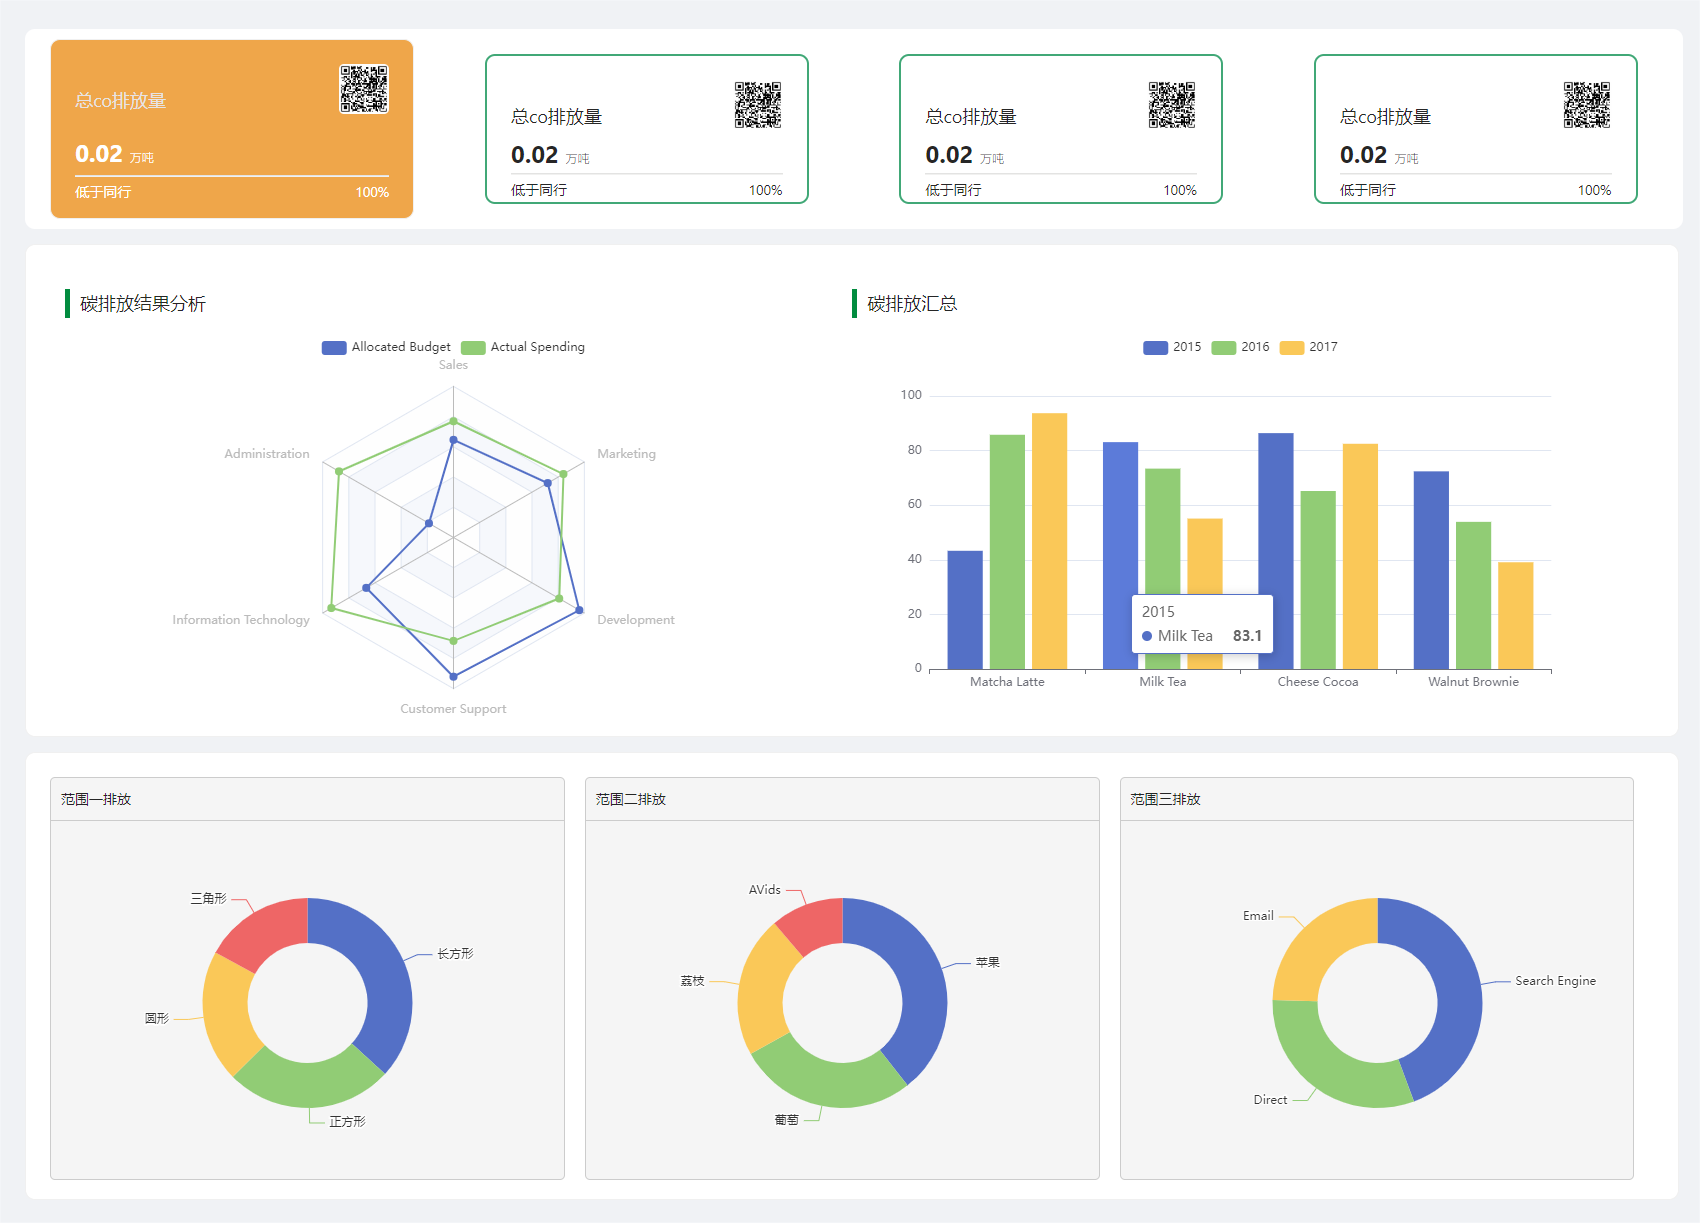
一、静态效果图
二,前期需要
2.1、vue3项目,Echart引入
2.2、原理解释略
案例代码1:


<template >
  <div id="radarChart"  style="width: 100%; height: 100%;"></div>
</template>

<script setup>
import * as echarts from 'echarts';
import { onMounted } from 'vue';
onMounted(() => initChart());
// 在这个初识化一个方法,包裹起来配置
const initChart = () => {
  const RadarChartDom = document.getElementById('radarChart');
  const myChart = echarts.init(RadarChartDom);
// 开始配置
  const option = {

  legend: {
    data: ['Allocated Budget', 'Actual Spending']
  },
  radar: {
    // shape: 'circle',
    indicator: [
      { name: 'Sales', max: 6500 },
      { name: 'Administration', max: 16000 },
      { name: 'Information Technology', max: 30000 },
      { name: 'Customer Support', max: 38000 },
      { name: 'Development', max: 52000 },
      { name: 'Marketing', max: 25000 }
    ]
  },
  series: [
    {
      name: 'Budget vs spending',
      type: 'radar',
      data: [
        {
          value: [4200, 3000, 20000, 35000, 50000, 18000],
          name: 'Allocated Budget'
        },
        {
          value: [5000, 14000, 28000, 26000, 42000, 21000],
          name: 'Actual Spending'
        }
      ]
    }
  ]
  };

  myChart.setOption(option);
  window.onresize = () => {
    myChart.resize();
  };
};


</script>
代码案例2:
<template>
  <div class="echarts-box">
    <div id="pieCenterChart" style="width: 100%;height: 100%; min-height: 300px;"></div>
  </div>
</template>
<script setup>
import * as echarts from "echarts";

    /// 声明定义一下echart
    let echart = echarts;
    onMounted(() => {
      initChart();
    });
    onUnmounted(() => {
      echart.dispose;
    });

    // 基础配置一下Echarts
    function initChart() {
      let chart = echart.init(document.getElementById("pieCenterChart"));
      // 把配置和数据放这里
      chart.setOption({

        tooltip: {
      trigger: "item",

    },
    series: [
      {
        name: "Access From",
        type: "pie",
        radius: ["40%", "70%"],
        data: [
          { value: 1048, name: "苹果" },
          { value: 735, name: "葡萄" },
          { value: 580, name: "荔枝" },
          { value: 300, name: "AVids" },
        ],
        emphasis: {
          itemStyle: {
            shadowBlur: 10,
            shadowOffsetX: 0,
            shadowColor: "rgba(0, 0, 0, 0.5)",
          },
        },
      },
    ],

      });

      window.onresize = function() {
        //自适应大小
        chart.resize();
      };
    }


</script>
代码案例3:
<template>
  <div class="echarts-box">
    <div id="pieCenterChart" style="width: 100%;height: 100%; min-height: 300px;"></div>
  </div>
</template>
<script setup>
import * as echarts from "echarts";

    /// 声明定义一下echart
    let echart = echarts;
    onMounted(() => {
      initChart();
    });
    onUnmounted(() => {
      echart.dispose;
    });

    // 基础配置一下Echarts
    function initChart() {
      let chart = echart.init(document.getElementById("pieCenterChart"));
      // 把配置和数据放这里
      chart.setOption({

        tooltip: {
      trigger: "item",

    },
    series: [
      {
        name: "Access From",
        type: "pie",
        radius: ["40%", "70%"],
        data: [
          { value: 1048, name: "苹果" },
          { value: 735, name: "葡萄" },
          { value: 580, name: "荔枝" },
          { value: 300, name: "AVids" },
        ],
        emphasis: {
          itemStyle: {
            shadowBlur: 10,
            shadowOffsetX: 0,
            shadowColor: "rgba(0, 0, 0, 0.5)",
          },
        },
      },
    ],

      });

      window.onresize = function() {
        //自适应大小
        chart.resize();
      };
    }


</script>
代码案例4:
<template>
  <div class="echarts-box">
    <div id="pieRightChart" style="width: 100%;height: 100%; min-height: 300px;"></div>
  </div>
</template>
<script setup>
import * as echarts from "echarts";

    /// 声明定义一下echart
    let echart = echarts;
    onMounted(() => {
      initChart();
    });
    onUnmounted(() => {
      echart.dispose;
    });

    // 基础配置一下Echarts
    function initChart() {
      let chart = echart.init(document.getElementById("pieRightChart"));
      // 把配置和数据放这里
      chart.setOption({

        tooltip: {
          trigger: 'item'
        },

        series: [
          {
            name: 'Access From',
            type: 'pie',
            radius: ['40%', '70%'],
            data: [
              { value: 1048, name: 'Search Engine' },
              { value: 735, name: 'Direct' },
              { value: 580, name: 'Email' },
              // { value: 484, name: 'Union Ads' },
              // { value: 300, name: 'Video Ads' }
            ],
            emphasis: {
              itemStyle: {
                shadowBlur: 10,
                shadowOffsetX: 0,
                shadowColor: 'rgba(0, 0, 0, 0.5)'
              }
            }
          }
        ]
      });
      window.onresize = function() {
        //自适应大小
        chart.resize();
      };
    }


</script>
代码案例5:
<template>
  <div class="echarts-box">
    <div id="pieRightChart" style="width: 100%;height: 100%; min-height: 300px;"></div>
  </div>
</template>
<script setup>
import * as echarts from "echarts";

    /// 声明定义一下echart
    let echart = echarts;
    onMounted(() => {
      initChart();
    });
    onUnmounted(() => {
      echart.dispose;
    });

    // 基础配置一下Echarts
    function initChart() {
      let chart = echart.init(document.getElementById("pieRightChart"));
      // 把配置和数据放这里
      chart.setOption({

        tooltip: {
          trigger: 'item'
        },

        series: [
          {
            name: 'Access From',
            type: 'pie',
            radius: ['40%', '70%'],
            data: [
              { value: 1048, name: 'Search Engine' },
              { value: 735, name: 'Direct' },
              { value: 580, name: 'Email' },
              // { value: 484, name: 'Union Ads' },
              // { value: 300, name: 'Video Ads' }
            ],
            emphasis: {
              itemStyle: {
                shadowBlur: 10,
                shadowOffsetX: 0,
                shadowColor: 'rgba(0, 0, 0, 0.5)'
              }
            }
          }
        ]
      });
      window.onresize = function() {
        //自适应大小
        chart.resize();
      };
    }


</script>
首页:
<template>
<div>
<div>
<a-row>
<a-col :span="20" style="text-align: center; font-size: 20px;font-weight: bold;color: #343536;">
<p><span>2027年</span> 柏旷科技有限公司 <span>碳排放记录结果分析</span></p>
</a-col>
<a-col :span="4" style="text-align: right;">
<a-button style="margin-right: 8px" @click="onClose">关闭</a-button>
</a-col>
</a-row>
</div>
<!-- 四个小卡片 -->
<div style="height: 200px; margin: 15px;" class="fist">
<div class="item">
<a-card class="bigbox">
<a-row>
<a-col :span="12" style="display: flex; align-items: flex-end">
<div class="text">总co排放量</div>
</a-col>
<a-col :span="12" style="text-align: right">
<div>
<img
style="width: 50px; height: 50px; border-radius: 5px"
src="https://img0.baidu.com/it/u=582752653,3386538207&fm=253&fmt=auto&app=138&f=GIF?w=500&h=500"
alt=""
/>
</div>
</a-col>
</a-row>
<div style="margin-top: 20px">
<a-row>
<a-col :span="20" style="display: flex; align-items: flex-end">
<div class="text2">0.02 <span class="span">万吨</span></div>
</a-col>
<a-col :span="2" style="text-align: right"> </a-col>
</a-row>
<a-divider style="height: 2px; background-color: #f1f1f0; margin-top: 3px" />
<a-row style="margin-top: -20px">
<a-col :span="12">
<div class="text3"><span>低于同行</span></div>
</a-col>
<a-col :span="12" style="text-align: right">
<span class="text3">100%</span>
</a-col>
</a-row>
</div>
</a-card>
</div>
<div class="item">
<a-card class="box">
<a-row>
<a-col :span="12" style="display: flex; align-items: flex-end">
<div class="text4">总co排放量</div>
</a-col>
<a-col :span="12" style="text-align: right">
<div>
<img
style="width: 50px; height: 50px; border-radius: 5px"
src="https://img0.baidu.com/it/u=582752653,3386538207&fm=253&fmt=auto&app=138&f=GIF?w=500&h=500"
alt=""
/>
</div>
</a-col>
</a-row>
<div style="margin-top: 5px">
<a-row>
<a-col :span="12" style="display: flex; align-items: flex-end">
<div class="text5">0.02 <span class="span">万吨</span></div>
</a-col>
<a-col :span="12" style="text-align: right"> </a-col>
</a-row>
<a-divider style="height: 2px; background-color: #f1f1f0; margin-top: 0px" />
<a-row style="margin-top: -20px">
<a-col :span="12">
<div><span>低于同行</span></div>
</a-col>
<a-col :span="12" style="text-align: right">
<span>100%</span>
</a-col>
</a-row>
</div>
</a-card>
</div>
</div>
<!-- 2个组件 -->
<a-card class="card3">
<div class="second">
<div class="left">
<p style="margin-top: -5vh;" class="long">碳排放结果分析</p>
<left-radar-chart style="width: 100%;height: 100%;"></left-radar-chart>
</div>
<div class="right">
<p style="margin-top: -5vh;" class="long">碳排放汇总</p><right-bar-chart></right-bar-chart></div>
</div>
</a-card>
<!-- 三个饼图 3个组件 -->
<div class="third">
<a-card class="card2">
<div class="card-pie">
<div class="pie">
<div class="title">范围一排放</div>
<div style="border-bottom: 1px solid #ccc"></div>
<div style="margin-top: 2rem;">
<pie-left-chart style="width: 100%; height: 100%"></pie-left-chart>
</div>
</div>
<div class="pie">
<div class="title">范围二排放</div>
<div style="border-bottom: 1px solid #ccc"></div>
<div style="margin-top: 2rem;">
<pie-center-chart style="width: 100%; height: 100%"></pie-center-chart>
</div>
</div>
<div class="pie"><div class="title">范围三排放</div><div style="border-bottom: 1px solid #ccc;"></div>
<div style="margin-top: 2rem;">
<pie-right-chart style="width: 100%; height: 100%"></pie-right-chart>
</div>
</div>
</div>
</a-card>
</div>
</div>
</template>
<script setup>
import PieRightChart from './component/pieRightChart.vue'
import PieCenterChart from './component/pieCenterChart.vue'
import PieLeftChart from './component/pieLeftChart.vue'
import RightBarChart from './component/rightBarChart.vue'
import LeftRadarChart from './component/leftRadarChart.vue'
const emit = defineEmits({ change: null })
const onClose = () => {
emit('change')
}
</script>
<style>
.long {
display: inline-block;
padding-left: 10px;
border-left: 5px solid #028c3f;
font-size: 18px;
/* font-size: 20px; */
}
.title {
margin: 10px;
}
.card-pie {
display: flex;
justify-content: center;
height: 50vh;
}
.pie {
background-color: #f5f5f5;
flex: 1;
width: 30%;
height: 45vh;
border: 1px solid #ccc;
border-radius: 5px;
margin: 0 20px 10px 0;
}
.card2 {
margin: 15px;
width: 98%;
height: 50vh;
border-radius: 10px;
}
.card3 {
margin: 15px;
width: 98%;
height: 55vh;
border-radius: 10px;
}
.second {
margin: 15px;
display: flex;
flex-direction: row;
}
.left {
flex: 1;
width: 50%;
/* border: 1px solid #ccc; */
height: 45vh;
margin: 10px 10px 10px 0;
border-radius: 5px;
/* box-shadow: 0px 0px 2px 2px #f5ecec; */
}
.right {
flex: 1;
width: 50%;
/* border: 1px solid #ccc; */
height: 45vh;
margin: 10px 10px 10px 0;
}
.text5 {
font-size: 24px;
font-weight: bold;
}
.text4 {
font-size: 18px;
}
.box {
border: 2px solid #41a877;
height: 150px;
width: 80%;
border-radius: 10px;
}
.text3 {
color: white;
}
.text2 {
font-weight: bold;
font-size: 24px;
color: white;
}
.span {
font-size: 12px;
font-weight: 100;
}
.text {
font-size: 18px;
color: rgb(231, 227, 227);
}
.bigbox {
align-self: center;
width: 90%;
background: #efa64a;
height: 180px;
border-radius: 10px;
}
.fist {
display: flex;
background-color: #fff;
border-radius: 10px;
}
.item {
flex: 1;
/* border: 1px solid #ccc; */
margin: 5px;
display: flex;
justify-content: center;
align-items: center;
}
</style>

 浙公网安备 33010602011771号