


Pushing the Limits of Windows: Virtual Memory
In my first Pushing the Limits of Windows post, I discussed physical memory limits, including the limits imposed by licensing, implementation, and driver compatibility. Here’s the index of the entire Pushing the Limits series. While they can stand on their own, they assume that you read them in order.
Pushing the Limits of Windows: Physical Memory
Pushing the Limits of Windows: Virtual Memory
Pushing the Limits of Windows: Paged and Nonpaged Pool
Pushing the Limits of Windows: Processes and Threads
Pushing the Limits of Windows: Handles
Pushing the Limits of Windows: USER and GDI Objects – Part 1
Pushing the Limits of Windows: USER and GDI Objects – Part 2
This time I’m turning my attention to another fundamental resource, virtual memory. Virtual memory separates a program’s view of memory from the system’s physical memory, so an operating system decides when and if to store the program’s code and data in physical memory and when to store it in a file. The major advantage of virtual memory is that it allows more processes to execute concurrently than might otherwise fit in physical memory.
While virtual memory has limits that are related to physical memory limits, virtual memory has limits that derive from different sources and that are different depending on the consumer. For example, there are virtual memory limits that apply to individual processes that run applications, the operating system, and for the system as a whole. It's important to remember as you read this that virtual memory, as the name implies, has no direct connection with physical memory. Windows assigning the file cache a certain amount of virtual memory does not dictate how much file data it actually caches in physical memory; it can be any amount from none to more than the amount that's addressable via virtual memory.
Process Address Spaces
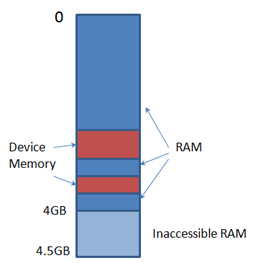
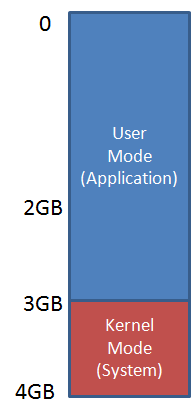
Each process has its own virtual memory, called an address space, into which it maps the code that it executes and the data that the code references and manipulates. A 32-bit process uses 32-bit virtual memory address pointers, which creates an absolute upper limit of 4GB (2^32) for the amount of virtual memory that a 32-bit process can address. However, so that the operating system can reference its own code and data and the code and data of the currently-executing process without changing address spaces, the operating system makes its virtual memory visible in the address space of every process. By default, 32-bit versions of Windows split the process address space evenly between the system and the active process, creating a limit of 2GB for each:

Applications might use Heap APIs, the .NET garbage collector, or the C runtime malloc library to allocate virtual memory, but under the hood all of these rely on the VirtualAlloc API. When an application runs out of address space then VirtualAlloc, and therefore the memory managers layered on top of it, return errors (represented by a NULL address). The Testlimit utility, which I wrote for the 4th Edition of Windows Internals to demonstrate various Windows limits, calls VirtualAlloc repeatedly until it gets an error when you specify the –r switch. Thus, when you run the 32-bit version of Testlimit on 32-bit Windows, it will consume the entire 2GB of its address space:

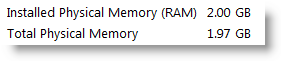
2010 MB isn’t quite 2GB, but Testlimit’s other code and data, including its executable and system DLLs, account for the difference. You can see the total amount of address space it’s consumed by looking at its Virtual Size in Process Explorer:

Some applications, like SQL Server and Active Directory, manage large data structures and perform better the more that they can load into their address space at the same time. Windows NT 4 SP3 therefore introduced a boot option, /3GB, that gives a process 3GB of its 4GB address space by reducing the size of the system address space to 1GB, and Windows XP and Windows Server 2003 introduced the /userva option that moves the split anywhere between 2GB and 3GB:
To take advantage of the address space above the 2GB line, however, a process must have the ‘large address space aware’ flag set in its executable image. Access to the additional virtual memory is opt-in because some applications have assumed that they’d be given at most 2GB of the address space. Since the high bit of a pointer referencing an address below 2GB is always zero, they would use the high bit in their pointers as a flag for their own data, clearing it of course before referencing the data. If they ran with a 3GB address space they would inadvertently truncate pointers that have values greater than 2GB, causing program errors including possible data corruption.
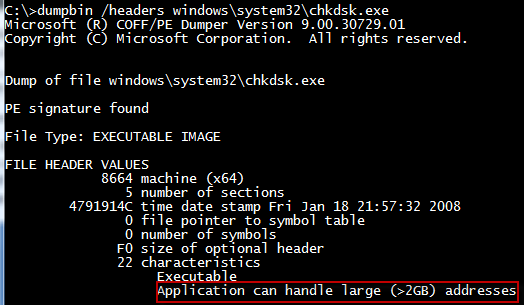
All Microsoft server products and data intensive executables in Windows are marked with the large address space awareness flag, including Chkdsk.exe, Lsass.exe (which hosts Active Directory services on a domain controller), Smss.exe (the session manager), and Esentutl.exe (the Active Directory Jet database repair tool). You can see whether an image has the flag with the Dumpbin utility, which comes with Visual Studio:
Testlimit is also marked large-address aware, so if you run it with the –r switch when booted with the 3GB of user address space, you’ll see something like this:

Because the address space on 64-bit Windows is much larger than 4GB, something I’ll describe shortly, Windows can give 32-bit processes the maximum 4GB that they can address and use the rest for the operating system’s virtual memory. If you run Testlimit on 64-bit Windows, you’ll see it consume the entire 32-bit addressable address space:

64-bit processes use 64-bit pointers, so their theoretical maximum address space is 16 exabytes (2^64). However, Windows doesn’t divide the address space evenly between the active process and the system, but instead defines a region in the address space for the process and others for various system memory resources, like system page table entries (PTEs), the file cache, and paged and non-paged pools.
The size of the process address space is different on IA64 and x64 versions of Windows where the sizes were chosen by balancing what applications need against the memory costs of the overhead (page table pages and translation lookaside buffer - TLB - entries) needed to support the address space. On x64, that’s 8192GB (8TB) and on IA64 it’s 7168GB (7TB - the 1TB difference from x64 comes from the fact that the top level page directory on IA64 reserves slots for Wow64 mappings). On both IA64 and x64 versions of Windows, the size of the various resource address space regions is 128GB (e.g. non-paged pool is assigned 128GB of the address space), with the exception of the file cache, which is assigned 1TB. The address space of a 64-bit process therefore looks something like this:

The figure isn’t drawn to scale, because even 8TB, much less 128GB, would be a small sliver. Suffice it to say that like our universe, there’s a lot of emptiness in the address space of a 64-bit process.
When you run the 64-bit version of Testlimit (Testlimit64) on 64-bit Windows with the –r switch, you’ll see it consume 8TB, which is the size of the part of the address space it can manage:


Committed Memory
Testlimit’s –r switch has it reserve virtual memory, but not actually commit it. Reserved virtual memory can’t actually store data or code, but applications sometimes use a reservation to create a large block of virtual memory and then commit it as needed to ensure that the committed memory is contiguous in the address space. When a process commits a region of virtual memory, the operating system guarantees that it can maintain all the data the process stores in the memory either in physical memory or on disk. That means that a process can run up against another limit: the commit limit.
As you’d expect from the description of the commit guarantee, the commit limit is the sum of physical memory and the sizes of the paging files. In reality, not quite all of physical memory counts toward the commit limit since the operating system reserves part of physical memory for its own use. The amount of committed virtual memory for all the active processes, called the current commit charge, cannot exceed the system commit limit. When the commit limit is reached, virtual allocations that commit memory fail. That means that even a standard 32-bit process may get virtual memory allocation failures before it hits the 2GB address space limit.
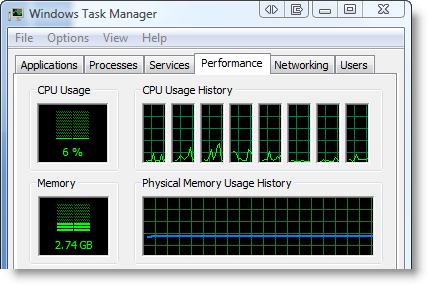
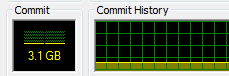
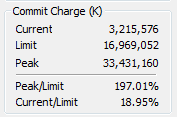
The current commit charge and commit limit is tracked by Process Explorer in its System Information window in the Commit Charge section and in the Commit History bar chart and graph:

Task Manager prior to Vista and Windows Server 2008 shows the current commit charge and limit similarly, but calls the current commit charge "PF Usage" in its graph:
On Vista and Server 2008, Task Manager doesn't show the commit charge graph and labels the current commit charge and limit values with "Page File" (despite the fact that they will be non-zero values even if you have no paging file):

You can stress the commit limit by running Testlimit with the -m switch, which directs it to allocate committed memory. The 32-bit version of Testlimit may or may not hit its address space limit before hitting the commit limit, depending on the size of physical memory, the size of the paging files and the current commit charge when you run it. If you're running 32-bit Windows and want to see how the system behaves when you hit the commit limit, simply run multiple instances of Testlimit until one hits the commit limit before exhausting its address space.
Note that, by default, the paging file is configured to grow, which means that the commit limit will grow when the commit charge nears it. And even when when the paging file hits its maximum size, Windows is holding back some memory and its internal tuning, as well as that of applications that cache data, might free up more. Testlimit anticipates this and when it reaches the commit limit, it sleeps for a few seconds and then tries to allocate more memory, repeating this indefinitely until you terminate it.
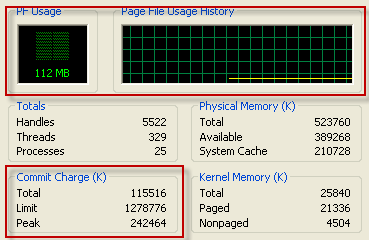
If you run the 64-bit version of Testlimit, it will almost certainly will hit the commit limit before exhausting its address space, unless physical memory and the paging files sum to more than 8TB, which as described previously is the size of the 64-bit application-accessible address space. Here's the partial output of the 64-bit Testlimit running on my 8GB system (I specified an allocation size of 100MB to make it leak more quickly):

And here's the commit history graph with steps when Testlimit paused to allow the paging file to grow:

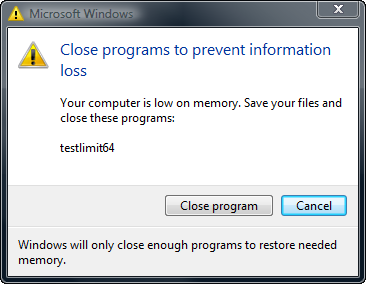
When system virtual memory runs low, applications may fail and you might get strange error messages when attempting routine operations. In most cases, though, Windows will be able present you the low-memory resolution dialog, like it did for me when I ran this test:
After you exit Testlimit, the commit limit will likely drop again when the memory manager truncates the tail of the paging file that it created to accommodate Testlimit's extreme commit requests. Here, Process Explorer shows that the current limit is well below the peak that was achieved when Testlimit was running:
Process Committed Memory
Because the commit limit is a global resource whose consumption can lead to poor performance, application failures and even system failure, a natural question is 'how much are processes contributing the commit charge'? To answer that question accurately, you need to understand the different types of virtual memory that an application can allocate.
Not all the virtual memory that a process allocates counts toward the commit limit. As you've seen, reserved virtual memory doesn't. Virtual memory that represents a file on disk, called a file mapping view, also doesn't count toward the limit unless the application asks for copy-on-write semantics, because Windows can discard any data associated with the view from physical memory and then retrieve it from the file. The virtual memory in Testlimit's address space where its executable and system DLL images are mapped therefore don't count toward the commit limit. There are two types of process virtual memory that do count toward the commit limit: private and pagefile-backed.
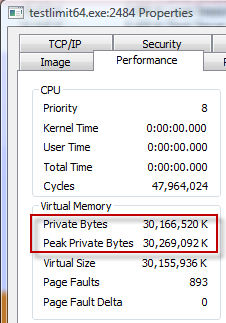
Private virtual memory is the kind that underlies the garbage collector heap, native heap and language allocators. It's called private because by definition it can't be shared between processes. For that reason, it's easy to attribute to a process and Windows tracks its usage with the Private Bytes performance counter. Process Explorer displays a process private bytes usage in the Private Bytes column, in the Virtual Memory section of the Performance page of the process properties dialog, and displays it in graphical form on the Performance Graph page of the process properties dialog. Here's what Testlimit64 looked like when it hit the commit limit:

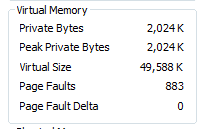
Pagefile-backed virtual memory is harder to attribute, because it can be shared between processes. In fact, there's no process-specific counter you can look at to see how much a process has allocated or is referencing. When you run Testlimit with the -s switch, it allocates pagefile-backed virtual memory until it hits the commit limit, but even after consuming over 29GB of commit, the virtual memory statistics for the process don't provide any indication that it's the one responsible:
For that reason, I added the -l switch to Handle a while ago. A process must open a pagefile-backed virtual memory object, called a section, for it to create a mapping of pagefile-backed virtual memory in its address space. While Windows preserves existing virtual memory even if an application closes the handle to the section that it was made from, most applications keep the handle open. The -l switch prints the size of the allocation for pagefile-backed sections that processes have open. Here's partial output for the handles open by Testlimit after it has run with the -s switch:
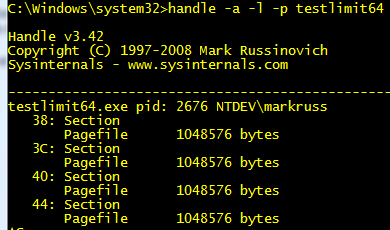
You can see that Testlimit is allocating pagefile-backed memory in 1MB blocks and if you summed the size of all the sections it had opened, you'd see that it was at least one of the processes contributing large amounts to the commit charge.
How Big Should I Make the Paging File?
Perhaps one of the most commonly asked questions related to virtual memory is, how big should I make the paging file? There’s no end of ridiculous advice out on the web and in the newsstand magazines that cover Windows, and even Microsoft has published misleading recommendations. Almost all the suggestions are based on multiplying RAM size by some factor, with common values being 1.2, 1.5 and 2. Now that you understand the role that the paging file plays in defining a system’s commit limit and how processes contribute to the commit charge, you’re well positioned to see how useless such formulas truly are.
Since the commit limit sets an upper bound on how much private and pagefile-backed virtual memory can be allocated concurrently by running processes, the only way to reasonably size the paging file is to know the maximum total commit charge for the programs you like to have running at the same time. If the commit limit is smaller than that number, your programs won’t be able to allocate the virtual memory they want and will fail to run properly.
So how do you know how much commit charge your workloads require? You might have noticed in the screenshots that Windows tracks that number and Process Explorer shows it: Peak Commit Charge. To optimally size your paging file you should start all the applications you run at the same time, load typical data sets, and then note the commit charge peak (or look at this value after a period of time where you know maximum load was attained). Set the paging file minimum to be that value minus the amount of RAM in your system (if the value is negative, pick a minimum size to permit the kind of crash dump you are configured for). If you want to have some breathing room for potentially large commit demands, set the maximum to double that number.
Some feel having no paging file results in better performance, but in general, having a paging file means Windows can write pages on the modified list (which represent pages that aren’t being accessed actively but have not been saved to disk) out to the paging file, thus making that memory available for more useful purposes (processes or file cache). So while there may be some workloads that perform better with no paging file, in general having one will mean more usable memory being available to the system (never mind that Windows won’t be able to write kernel crash dumps without a paging file sized large enough to hold them).
Paging file configuration is in the System properties, which you can get to by typing “sysdm.cpl” into the Run dialog, clicking on the Advanced tab, clicking on the Performance Options button, clicking on the Advanced tab (this is really advanced), and then clicking on the Change button:

You’ll notice that the default configuration is for Windows to automatically manage the page file size. When that option is set on Windows XP and Server 2003, Windows creates a single paging file that’s minimum size is 1.5 times RAM if RAM is less than 1GB, and RAM if it's greater than 1GB, and that has a maximum size that's three times RAM. On Windows Vista and Server 2008, the minimum is intended to be large enough to hold a kernel-memory crash dump and is RAM plus 300MB or 1GB, whichever is larger. The maximum is either three times the size of RAM or 4GB, whichever is larger. That explains why the peak commit on my 8GB 64-bit system that’s visible in one of the screenshots is 32GB. I guess whoever wrote that code got their guidance from one of those magazines I mentioned!
A couple of final limits related to virtual memory are the maximum size and number of paging files supported by Windows. 32-bit Windows has a maximum paging file size of 16TB (4GB if you for some reason run in non-PAE mode) and 64-bit Windows can having paging files that are up to 16TB in size on x64 and 32TB on IA64. Windows 8 ARM’s maximum paging file size is is 4GB. For all versions, Windows supports up to 16 paging files, where each must be on a separate volume.
|
Version |
Limit on x86 w/o PAE |
Limit on x86 w/PAE |
Limit on ARM |
Limit on x64 |
Limit on IA64 |
|
Windows 7 |
4 GB |
16 TB |
16 TB |
||
|
Windows 8 |
16 TB |
4 GB |
16 TB |
||
|
Windows Server 2008 R2 |
16 TB |
32 TB |
|||
|
Windows Server 2012 |
16 TB |
|
Pushing the Limits of Windows: Paged and Nonpaged Pool
In previous Pushing the Limits posts, I described the two most basic system resources, physical memory and virtual memory. This time I’m going to describe two fundamental kernel resources, paged pool and nonpaged pool, that are based on those, and that are directly responsible for many other system resource limits including the maximum number of processes, synchronization objects, and handles.
Here’s the index of the entire Pushing the Limits series. While they can stand on their own, they assume that you read them in order.
Pushing the Limits of Windows: Physical Memory
Pushing the Limits of Windows: Virtual Memory
Pushing the Limits of Windows: Paged and Nonpaged Pool
Pushing the Limits of Windows: Processes and Threads
Pushing the Limits of Windows: Handles
Pushing the Limits of Windows: USER and GDI Objects – Part 1
Pushing the Limits of Windows: USER and GDI Objects – Part 2
Paged and nonpaged pools serve as the memory resources that the operating system and device drivers use to store their data structures. The pool manager operates in kernel mode, using regions of the system’s virtual address space (described in the Pushing the Limits post on virtual memory) for the memory it sub-allocates. The kernel’s pool manager operates similarly to the C-runtime and Windows heap managers that execute within user-mode processes. Because the minimum virtual memory allocation size is a multiple of the system page size (4KB on x86 and x64), these subsidiary memory managers carve up larger allocations into smaller ones so that memory isn’t wasted.
For example, if an application wants a 512-byte buffer to store some data, a heap manager takes one of the regions it has allocated and notes that the first 512-bytes are in use, returning a pointer to that memory and putting the remaining memory on a list it uses to track free heap regions. The heap manager satisfies subsequent allocations using memory from the free region, which begins just past the 512-byte region that is allocated.
Nonpaged Pool
The kernel and device drivers use nonpaged pool to store data that might be accessed when the system can’t handle page faults. The kernel enters such a state when it executes interrupt service routines (ISRs) and deferred procedure calls (DPCs), which are functions related to hardware interrupts. Page faults are also illegal when the kernel or a device driver acquires a spin lock, which, because they are the only type of lock that can be used within ISRs and DPCs, must be used to protect data structures that are accessed from within ISRs or DPCs and either other ISRs or DPCs or code executing on kernel threads. Failure by a driver to honor these rules results in the most common crash code, IRQL_NOT_LESS_OR_EQUAL.
Nonpaged pool is therefore always kept present in physical memory and nonpaged pool virtual memory is assigned physical memory. Common system data structures stored in nonpaged pool include the kernel and objects that represent processes and threads, synchronization objects like mutexes, semaphores and events, references to files, which are represented as file objects, and I/O request packets (IRPs), which represent I/O operations.
Paged Pool
Paged pool, on the other hand, gets its name from the fact that Windows can write the data it stores to the paging file, allowing the physical memory it occupies to be repurposed. Just as for user-mode virtual memory, when a driver or the system references paged pool memory that’s in the paging file, an operation called a page fault occurs, and the memory manager reads the data back into physical memory. The largest consumer of paged pool, at least on Windows Vista and later, is typically the Registry, since references to registry keys and other registry data structures are stored in paged pool. The data structures that represent memory mapped files, called sections internally, are also stored in paged pool.
Device drivers use the ExAllocatePoolWithTag API to allocate nonpaged and paged pool, specifying the type of pool desired as one of the parameters. Another parameter is a 4-byte Tag, which drivers are supposed to use to uniquely identify the memory they allocate, and that can be a useful key for tracking down drivers that leak pool, as I’ll show later.
Viewing Paged and Nonpaged Pool Usage
There are three performance counters that indicate pool usage:
- Pool nonpaged bytes
- Pool paged bytes (virtual size of paged pool – some may be paged out)
- Pool paged resident bytes (physical size of paged pool)
However, there are no performance counters for the maximum size of these pools. They can be viewed with the kernel debugger !vm command, but with Windows Vista and later to use the kernel debugger in local kernel debugging mode you must boot the system in debugging mode, which disables MPEG2 playback.
So instead, use Process Explorer to view both the currently allocated pool sizes, as well as the maximum. To see the maximum, you’ll need to configure Process Explorer to use symbol files for the operating system. First, install the latest Debugging Tools for Windows package. Then run Process Explorer and open the Symbol Configuration dialog in the Options menu and point it at the dbghelp.dll in the Debugging Tools for Windows installation directory and set the symbol path to point at Microsoft’s symbol server:

After you’ve configured symbols, open the System Information dialog (click System Information in the View menu or press Ctrl+I) to see the pool information in the Kernel Memory section. Here’s what that looks like on a 2GB Windows XP system:

2GB 32-bit Windows XP
Nonpaged Pool Limits
As I mentioned in a previous post, on 32-bit Windows, the system address space is 2GB by default. That inherently caps the upper bound for nonpaged pool (or any type of system virtual memory) at 2GB, but it has to share that space with other types of resources such as the kernel itself, device drivers, system Page Table Entries (PTEs), and cached file views.
Prior to Vista, the memory manager on 32-bit Windows calculates how much address space to assign each type at boot time. Its formulas takes into account various factors, the main one being the amount of physical memory on the system. The amount it assigns to nonpaged pool starts at 128MB on a system with 512MB and goes up to 256MB for a system with a little over 1GB or more. On a system booted with the /3GB option, which expands the user-mode address space to 3GB at the expense of the kernel address space, the maximum nonpaged pool is 128MB. The Process Explorer screenshot shown earlier reports the 256MB maximum on a 2GB Windows XP system booted without the /3GB switch.
The memory manager in 32-bit Windows Vista and later, including Server 2008 and Windows 7 (there is no 32-bit version of Windows Server 2008 R2) doesn’t carve up the system address statically; instead, it dynamically assigns ranges to different types of memory according to changing demands. However, it still sets a maximum for nonpaged pool that’s based on the amount of physical memory, either slightly more than 75% of physical memory or 2GB, whichever is smaller. Here’s the maximum on a 2GB Windows Server 2008 system:

2GB 32-bit Windows Server 2008
64-bit Windows systems have a much larger address space, so the memory manager can carve it up statically without worrying that different types might not have enough space. 64-bit Windows XP and Windows Server 2003 set the maximum nonpaged pool to a little over 400K per MB of RAM or 128GB, whichever is smaller. Here’s a screenshot from a 2GB 64-bit Windows XP system:

2GB 64-bit Windows XP
64-bit Windows Vista, Windows Server 2008, Windows 7 and Windows Server 2008 R2 memory managers match their 32-bit counterparts (where applicable – as mentioned earlier, there is no 32-bit version of Windows Server 2008 R2) by setting the maximum to approximately 75% of RAM, but they cap the maximum at 128GB instead of 2GB. Here’s the screenshot from a 2GB 64-bit Windows Vista system, which has a nonpaged pool limit similar to that of the 32-bit Windows Server 2008 system shown earlier.

2GB 32-bit Windows Server 2008
Finally, here’s the limit on an 8GB 64-bit Windows 7 system:

8GB 64-bit Windows 7
Here’s a table summarizing the nonpaged pool limits across different version of Windows:
| 32-bit | 64-bit | |
| XP, Server 2003 | up to 1.2GB RAM: 32-256 MB > 1.2GB RAM: 256MB | min( ~400K/MB of RAM, 128GB) |
| Vista, Server 2008, Windows 7, Server 2008 R2 | min( ~75% of RAM, 2GB) | min(~75% of RAM, 128GB) |
| Windows 8, Server 2012 | min( ~75% of RAM, 2GB) | min( 2x RAM, 128GB) |
Paged Pool Limits
The kernel and device drivers use paged pool to store any data structures that won’t ever be accessed from inside a DPC or ISR or when a spinlock is held. That’s because the contents of paged pool can either be present in physical memory or, if the memory manager’s working set algorithms decide to repurpose the physical memory, be sent to the paging file and demand-faulted back into physical memory when referenced again. Paged pool limits are therefore primarily dictated by the amount of system address space the memory manager assigns to paged pool, as well as the system commit limit.
On 32-bit Windows XP, the limit is calculated based on how much address space is assigned other resources, most notably system PTEs, with an upper limit of 491MB. The 2GB Windows XP System shown earlier has a limit of 360MB, for example:
2GB 32-bit Windows XP
32-bit Windows Server 2003 reserves more space for paged pool, so its upper limit is 650MB.
Since 32-bit Windows Vista and later have dynamic kernel address space, they simply set the limit to 2GB. Paged pool will therefore run out either when the system address space is full or the system commit limit is reached.
64-bit Windows XP and Windows Server 2003 set their maximums to four times the nonpaged pool limit or 128GB, whichever is smaller. Here again is the screenshot from the 64-bit Windows XP system, which shows that the paged pool limit is exactly four times that of nonpaged pool:
2GB 64-bit Windows XP
Finally, 64-bit versions of Windows Vista, Windows Server 2008, Windows 7 and Windows Server 2008 R2 simply set the maximum to 128GB, allowing paged pool’s limit to track the system commit limit. Here’s the screenshot of the 64-bit Windows 7 system again:
8GB 64-bit Windows 7
Here’s a summary of paged pool limits across operating systems:
| 32-bit | 64-bit | |
| XP, Server 2003 | XP: up to 491MB Server 2003: up to 650MB | min( 4 * nonpaged pool limit, 128GB) |
| Vista, Server 2008, Windows 7, Server 2008 R2 | min( system commit limit, 2GB) | min( system commit limit, 128GB) |
| Windows 8, Server 2012 | min( system commit limit, 2GB) | min( system commit limit, 384GB) |
Testing Pool Limits
Because the kernel pools are used by almost every kernel operation, exhausting them can lead to unpredictable results. If you want to witness first hand how a system behaves when pool runs low, use the Notmyfault tool. It has options that cause it to leak either nonpaged or paged pool in the increment that you specify. You can change the leak size while it’s leaking if you want to change the rate of the leak and Notmyfault frees all the leaked memory when you exit it:

Don’t run this on a system unless you’re prepared for possible data loss, as applications and I/O operations will start failing when pool runs out. You might even get a blue screen if the driver doesn’t handle the out-of-memory condition correctly (which is considered a bug in the driver). The Windows Hardware Quality Laboratory (WHQL) stresses drivers using the Driver Verifier, a tool built into Windows, to make sure that they can tolerate out-of-pool conditions without crashing, but you might have third-party drivers that haven’t gone through such testing or that have bugs that weren’t caught during WHQL testing.
I ran Notmyfault on a variety of test systems in virtual machines to see how they behaved and didn’t encounter any system crashes, but did see erratic behavior. After nonpaged pool ran out on a 64-bit Windows XP system, for example, trying to launch a command prompt resulted in this dialog:

On a 32-bit Windows Server 2008 system where I already had a command prompt running, even simple operations like changing the current directory and directory listings started to fail after nonpaged pool was exhausted:

On one test system, I eventually saw this error message indicating that data had potentially been lost. I hope you never see this dialog on a real system!

Running out of paged pool causes similar errors. Here’s the result of trying to launch Notepad from a command prompt on a 32-bit Windows XP system after paged pool had run out. Note how Windows failed to redraw the window’s title bar and the different errors encountered for each attempt:

And here’s the start menu’s Accessories folder failing to populate on a 64-bit Windows Server 2008 system that’s out of paged pool:

Here you can see the system commit level, also displayed on Process Explorer’s System Information dialog, quickly rise as Notmyfault leaks large chunks of paged pool and hits the 2GB maximum on a 2GB 32-bit Windows Server 2008 system:

The reason that Windows doesn’t simply crash when pool is exhausted, even though the system is unusable, is that pool exhaustion can be a temporary condition caused by an extreme workload peak, after which pool is freed and the system returns to normal operation. When a driver (or the kernel) leaks pool, however, the condition is permanent and identifying the cause of the leak becomes important. That’s where the pool tags described at the beginning of the post come into play.
Tracking Pool Leaks
When you suspect a pool leak and the system is still able to launch additional applications, Poolmon, a tool in the Windows Driver Kit, shows you the number of allocations and outstanding bytes of allocation by type of pool and the tag passed into calls of ExAllocatePoolWithTag. Various hotkeys cause Poolmon to sort by different columns; to find the leaking allocation type, use either ‘b’ to sort by bytes or ‘d’ to sort by the difference between the number of allocations and frees. Here’s Poolmon running on a system where Notmyfault has leaked 14 allocations of about 100MB each:

After identifying the guilty tag in the left column, in this case ‘Leak’, the next step is finding the driver that’s using it. Since the tags are stored in the driver image, you can do that by scanning driver images for the tag in question. The Strings utility from Sysinternals dumps printable strings in the files you specify (that are by default a minimum of three characters in length), and since most device driver images are in the %Systemroot%\System32\Drivers directory, you can open a command prompt, change to that directory and execute “strings * | findstr <tag>”. After you’ve found a match, you can dump the driver’s version information with the Sysinternals Sigcheck utility. Here’s what that process looks like when looking for the driver using “Leak”:

If a system has crashed and you suspect that it’s due to pool exhaustion, load the crash dump file into the Windbg debugger, which is included in the Debugging Tools for Windows package, and use the !vm command to confirm it. Here’s the output of !vm on a system where Notmyfault has exhausted nonpaged pool:

Once you’ve confirmed a leak, use the !poolused command to get a view of pool usage by tag that’s similar to Poolmon’s. !poolused by default shows unsorted summary information, so specify 1 as the the option to sort by paged pool usage and 2 to sort by nonpaged pool usage:

Use Strings on the system where the dump came from to search for the driver using the tag that you find causing the problem.
So far in this blog series I’ve covered the most fundamental limits in Windows, including physical memory, virtual memory, paged and nonpaged pool. Next time I’ll talk about the limits for the number of processes and threads that Windows supports, which are limits that derive from these.
Comments
- Alex SilvaJanuary 1, 2003
- Mark RussinovichJanuary 1, 2003
@Carl: Thanks for the feedback. I've only run into pool leaks a few times in the last 10 years. Device drivers of any kind - hardware, file system filter, antivirus - can be guilty of it.
-
CrawfordMarch 27, 2009
I get delayed write failures every once in a while, and usually the cause for me is a glitch in the hibernation process. I've also discovered that you're almost guaranteed one if you hibernate while a USB-connected NTFS volume is mounted (even if you resume with the same drive connected to the same port). I've also gotten it once or twice by breaking my file server while writing to files. Fortunately, it's never actually caused any data loss for me.
-
AnonymousMarch 27, 2009The comment has been removed
- JonathanMarch 27, 2009
Server software that keeps many TCP/IP connections in the air can easily exhaust Non-paged pool. That happens on heavily-loaded ISA Servers for example - and is the reason why the next version of it is 64-bit only.
Crawford: Maybe it's because NTFS is always updated the last-access time of files? I think you can disable it with fsutil (fsutil behavior query disablelastaccess), though I don't know whether it's per-machine or per-volume.
- DavidMarch 27, 2009
Another great article. I learn so much, I recommend these articles to everyone.
- LookingForSolutionsMarch 28, 2009
Earlier this week, I was troubleshooting a customer's server where IIS6 had stopped accepting new connections. After checking the entries in the SYSTEM32LOGFILESHTTPERR logs, I searched on Google and found out it was due to available non-paged pool memory being less than 20MB, at which point IIS6 stops accepting new connections. Rebooting the server fixed the problem for now. When/if the problem returns, I'll try the troubleshooting steps from this excellent blogpost!
FYI, the related KB's:
http://support.microsoft.com/kb/934878
http://support.microsoft.com/kb/820729
"The kernel NonPagedPool memory has dropped below 20MB and http.sys has stopped receiving new connections"
- carlMarch 28, 2009
It is my understanding that storing Outlook PST files on network drives can cause nonpaged memory pool issues on 32-bit file Windows 2003 file servers.
More info on this in these articles:
http://blogs.technet.com/askperf/archive/2007/01/21/network-stored-pst-files-don-t-do-it.aspx
http://support.microsoft.com/?id=297019
There is probably enough information in this article to identify the PST-network drive issue. However, I'm guessing a lot of SysAdmins would really appreciate you taking those two links, combining what you've written here with the PST issue and explaining exactly how to identify and solve that issue.
-
MiralMarch 30, 2009
My 32-bit Vista machine gets *very* flaky when the non-paged pool hits 1GB or higher. (On a couple of occasions it truncated files that were being written at the time.)
In case anyone is interested: the leak was in the TdxA pool and was (possibly indirectly) caused by a poorly-written firewall/virusscan program. (I tracked this down using poolmon a few months ago.)
- DavidMarch 31, 2009
I've gotten the "Delayed Write Failed" error most of the times I've tried to use ntbackup on Windows Server 2003. Extremely unacceptable for such an important piece of software.
- nickMarch 31, 2009
Mark -
The timing of your articles never ceases to amaze. Just two weeks ago I was fighting with a server experiencing pool exhaustion, largely due to someone placing the /3GB switch into it's boot options. Process Explorer was (yet again) an invaluable tool to solve the problem.
Thanks again for the great articles and utilities.
-
Anonymous CowardMarch 31, 2009
Great article, Mark. I'm always amazed by the way you tackle these seemingly complicated things in such a straightforward manner.
- ChadMarch 31, 2009
Mark, great article & very timely for me as I'm getting 2019's every 4.5 days & I'm assuming it's 1 of many new print drivers that were recently loaded onto the server. I've begun using Poolman to try & diagnose which driver causes the leak, unfortunately when I attempt to use the poolmon -c switch to generate a "localtag.txt get the following error;
"Poolmon: No localtag.txt in current directory
Unable to load msvcr70.dll/msvcp70.dll, cannot create local tag file"
So I receive a number of "unknown driver" tags.....any ideas on how to help me further isolate this driver leak or get poolmon to successfully create a localtag.txt file?
Also, I fear it may be a event driven leak as I've been watching the nonpaged limit in process explorer for a couple of days & it's a very steady & not climbing.
Thanks again, the article was very straight-forward & helpful.
-
ClovisApril 1, 2009
Why is MPEG2 playback disabled if debugging is enabled? How do you debug MPEG2 drivers?
-
dirbaseApril 1, 2009
Mark,
Thanks for this post. This reminds me of a topic I started in the sysinternals forum back in January http://forum.sysinternals.com/forum_posts.asp?TID=17486 where I showed that on several XP (SP2/SP3) systems with NTFS partitions searching for a file via explorer search can take up a large portion of both page and non paged pools, which are not really released after the search has ended.This is presumably due to NTFS.sys.
I'm still wondering if it's an expected behaviour. What do you think?
-
AnonymousApril 1, 2009The comment has been removed
-
AnonymousApril 2, 2009The comment has been removed
- ChrisApril 2, 2009
The thing I don't understand is this:
When I install Windows (any version) on any of my machines, a quick look at the Task Manager shows me that a significant amount of memory is being paged.
but when I install Ubuntu on that same hardware, the page drive is zero
what's the deal with that?
-
AnonymousApril 3, 2009The comment has been removed
-
FridayApril 5, 2009
@Clovis: If they told you they'd have to sue you. :)
Oops, too late. :D
-
MPyleApril 14, 2009
Great article. Very clear.
But given that how does, Task-Manager define a per process count of Non-Paged-Pool memory usage?
I have a problem where we see a per process memory-pool rise.
-
GSApril 15, 2009
So what do you if you find more then 1 driver matching symbol string? How do I identify which one is actually causing this?
-
Timothy DavisApril 16, 2009
@GS and @Chad
You can use driver verifier to track pool usage by a driver. See [http://msdn.microsoft.com/en-us/library/ms792856.aspx] for more information
-
RWApril 17, 2009
Great article. I have a handle leak that accumulates in explorer.exe on my 4GB WinXP sp3 laptop. This occurs multiple times per week and is happening as I type this.
PoolMon shows:
Even Nonp 12848369 ( 427) 11400450 ( 430) 1447919 69507456 ( -144) 48
Total Handles 1,471,236 which of course means Windows is beginning to act up.
The techniques so far have not led me to tell what is leaking the handles. The Even tag I believes it is unknown.
Explorer.exe handles total is 1,437,260
- LookingForSolutionsApril 18, 2009
Sure enough, the problem which I mentioned in my previous post has returned. This time I used poolmon to track the culprit. It turned out to be a faulty version of the Microsoft MPIO driver (version 1.21 leaks nonpaged pool memory -> http://support.microsoft.com/kb/961640). This issue was happening on one (Windows Server 2003 x86) cluster node, while the other cluster node did not exhibit any problems. The other cluster node turned out to be using a different version of the MPIO driver which didn't have the memory leak bug.
-
reporterApril 23, 2009
Symantec Antivirus software is one of the software which i have seen allocating humungous amount of paged pool (almost ~70MB). it's surprising how they got away with this so far given the huge instll base (both retail and corporate) they have.
-
TechFreakApril 23, 2009
Good information, but nothing creative here.
For a deveoper like me, I rather liked the creativity and ingenuity of the idea in using pure Win32 and C++ to create Terabyte sized arrays on Win32 machines (without tweaking anything that too):
http://blogs.msdn.com/gpalem/archive/2008/06/05/huge-arrays-with-file-mapping.aspx
Thats what I call real pushing of limits. Whoever did it, I found it quite inspiring. Way to go Boys.
-AMiCo
NationalSemiConductors.
-
Andrew FidelApril 23, 2009
Easier than installing the DDK just to get poolmon is to install the support tools for your OS. For XP SP2 it's available at http://www.microsoft.com/downloads/details.aspx?FamilyId=49AE8576-9BB9-4126-9761-BA8011FABF38
-
TravisApril 30, 2009
Nice job. By far the best, most comprehensive guide on the subject.
-
AnonymousMay 22, 2009The comment has been removed
-
Remko WeijnenJune 1, 2009
Mark,
How about the other important resources (eg System PTE's, Session View Space, Sesion Paged Pool, Desktop Heap), it would be great if you can discuss these as well!
- JohnJuly 3, 2009
Someone at microsoft needs to code up a utility that automatically does the steps outlined in the tracing pool leaks section of this article, and returns the offending leaky driver/system file. People could then run the tool if they've been getting "insufficient system resources" errors, and that would help them fix their problem. Optionally they could upload the results to microsoft and microsoft could pass along such results to the software vendor in question or post advisories about those software products.
-
davetiyeNovember 2, 2009
güzel davetiye örnekleri davetiye modelleri düğün davetiyeleri
- BryanJanuary 12, 2010
Mark, awesome article, thank you very much!
-
LanruzehhJanuary 18, 2010
Hi,
Very nice article Mark.
I have a couple of questions,
1. Is it poosible to increase the Non Paged pool memory limit beyond 75% of RAM on Windows Server 2008 ?
2. If the answer to question 1 is yes, how can you do that ?
Thanks,
Lanruzehh
-
Ronald MJanuary 28, 2010
I have been trying to find the reason for a non paged pool leak on a windows server 2003 for quite some time now without much success. This happens randomly sometimes twice in a day. Here is the output from poolman when the non paged pool consumption was high. Is it possible to find from this output, the possible cause of the leak.
Memory:16771724K Avail:15716652K PageFlts: 76038 InRam Krnl: 2268K P:114036
Commit: 765728K Limit:33273512K Peak: 968688K Pool N:196572K P:1150
System pool information
Tag Type Allocs Frees Diff Bytes Per Alloc
Irp Nonp 15114034 (3654) 14980131 (3578) 133903 62270528 ( 33776) 465
usbp Nonp 292346 ( 136) 159911 ( 136) 132435 41995160 ( 0) 317
Mdl Nonp 578590 ( 286) 307149 ( 293) 271441 34807680 ( 80) 128
HidU Nonp 291648 ( 136) 159541 ( 136) 132107 13738616 ( 0) 103
MmCm Nonp 2463 ( 0) 2305 ( 0) 158 8316176 ( 0) 52634
MFE0 Nonp 210464239 (3115) 210434889 (3080) 29350 7450848 ( 3568) 253
HidC Nonp 264459 ( 0) 132319 ( 0) 132140 3175736 ( 0) 24
LSwi Nonp 1 ( 0) 0 ( 0) 1 2576384 ( 0) 2576384
Io Nonp 95706488 (65071) 95574219 (65071) 132269 2191368 ( 0) 1
HdCl Nonp 264402 ( 0) 132303 ( 0) 132099 2116896 ( 0) 16
TPLA Nonp 512 ( 0) 0 ( 0) 512 2097152 ( 0) 4096
TCPt Nonp 37255 ( 6) 37218 ( 6) 37 1664536 ( 0) 44987
File Nonp 13742294 ( 368) 13734330 ( 358) 7964 1213584 ( 1536) 152
VxSb Nonp 6 ( 0) 4 ( 0) 2 1171456 ( 0) 585728
Mm Nonp 1037 ( 0) 1025 ( 0) 12 1127512 ( 0) 93959
brcm Nonp 30 ( 0) 0 ( 0) 30 819184 ( 0) 27306
TCht Nonp 7652 ( 0) 7456 ( 58) 196 802816 (-237568) 4096
bRcm Nonp 8 ( 0) 0 ( 0) 8 685840 ( 0) 85730
naFF Nonp 299 ( 0) 1 ( 0) 298 656504 ( 0) 2203
Thre Nonp 155086 ( 7) 154036 ( 11) 1050 655200 ( -2496) 624
Pool Nonp 6 ( 0) 3 ( 0) 3 610304 ( 0) 203434
AfdC Nonp 149183 ( 30) 146111 ( 28) 3072 491520 ( 320) 160
LSwr Nonp 128 ( 0) 0 ( 0) 128 416768 ( 0) 3256
Even Nonp 3895544 ( 354) 3889534 ( 350) 6010 291088 ( 192) 48
Devi Nonp 705 ( 0) 350 ( 0) 355 270104 ( 0) 760
NDpp Nonp 95 ( 0) 14 ( 0) 81 267520 ( 0) 3302
TCPC Nonp 11370 ( 6) 8215 ( 0) 3155 265952 ( 480) 84
Vad Nonp 2730397 ( 9) 2725265 ( 9) 5132 246336 ( 0) 48
Hal Nonp 194560 ( 341) 194536 ( 340) 24 199968 ( 368) 8332
Ntf0 Nonp 3 ( 0) 0 ( 0) 3 196608 ( 0) 65536
Ntfr Nonp 20653 ( 0) 17959 ( 0) 2694 173384 ( 0) 64
AfdE Nonp 148107 ( 30) 147506 ( 28) 601 168280 ( 560) 280
TCPc Nonp 243685 ( 53) 240390 ( 49) 3295 158160 ( 192) 48
Sema Nonp 6766238 (2360) 6763555 (2360) 2683 150648 ( 0) 56
MmCi Nonp 27458 ( 0) 26860 ( 0) 598 141344 ( 0) 236
Dump Nonp 9 ( 0) 1 ( 0) 8 135600 ( 0) 16950
RceT Nonp 1 ( 0) 0 ( 0) 1 131072 ( 0) 131072
Muta Nonp 999419 ( 189) 997544 ( 189) 1875 125856 ( 0) 67
CcSc Nonp 255342 ( 10) 254961 ( 9) 381 121920 ( 320) 320
MmCa Nonp 1262482 ( 11) 1261431 ( 10) 1051 107792 ( 112) 102
VadS Nonp 1697218 (1113) 1694239 (1117) 2979 95328 ( -128) 32
Vadl Nonp 2237198 ( 116) 2235790 ( 118) 1408 90112 ( -128) 64
NtFs Nonp 874028 ( 18) 872463 ( 5) 1565 72712 ( 520) 46
Ntfi Nonp 115369 ( 12) 115125 ( 0) 244 66368 ( 3264) 272
Lfsr Nonp 6 ( 0) 2 ( 0) 4 65536 ( 0) 16384
PooL Nonp 8 ( 0) 0 ( 0) 8 65536 ( 0) 8192
AmlH Nonp 1 ( 0) 0 ( 0) 1 65536 ( 0) 65536
-
AnonymousMarch 22, 2010The comment has been removed
-
miguel qApril 15, 2010
Looking at the Process Explorer in Windows Server 2003 guest in VMware. I am able to see the Paged Physical and Virtual values but the Paged Limit reads "no symbols" What gives?
-
ncApril 16, 2010
@miguel q
You need to configure symbols in Process Explorer so it can access the symbols for the kernel image.
- DaveHMay 6, 2010
Hi Mark,
First, great post. I've used this information to try and trace what was using all the non-paged memory on my server 2003 system - it's an old system and still running SP0 so there could be many bugfixes which would explain my problem.
I was getting volsnap events stating that it couldn't allocate enough nonpaged memory to hold a bitmap for a snapshot of my C: drive.
volsnap uses 16KB blocks in it's bitmap, so on my 69GB drive, I calculated 552KB for the bitmap.
It took me a while to get the symbols for the system so that I could see the nonpage pool limit.
The system in question was using 100 MB of nonpaged pool memory. Procexp.exe gave a limit of 256 MB of nonpaged pool memory. More than enough free for the bitmap.
I was confused! I removed the shadowstorage for the C: drive from it's second volume D: so that it would just use the C: drive and the problem went away!
Do you think this is a bug in the SP0 VSS implementation or do you really think I was running out of nonpaged memory?
Thanks,
Dave.
-
TranaOctober 21, 2010
Great stuff, thanks.
I used to say an IT admin/support persons job is 50% Internet search, 50% compare settings side by side. But I am changing it to 33% Search, 33% Settings comparing and 34% Using tools created by Mark R.
Poolmon, Autoruns, Pagedefrag, ProcessExplorer, Disk2VHD, you name it...I love it!
March 30, 2011
Helpful article, thanks.
Also I would like to solicit opinion for the problem that I am debugging.
My software uses a Jungo driver for which I do not have a source code. At some point when I try to allocate memory it returns insufficient resource error.
I used a logger utility that came with the Jungo and extracted information that AllocateCommonBuffer fails which tells me that I am running out some memory resource somewhere. But I have plenty of physical memory ( 3 gb) which is available to me ( no special hardware hogging my memory making it unavailable to the system) . Since I am aware that kernel NonPaged pool is limited resource( 128 M on my system according to NonPagedPoolSize key in registery ) I have decided to use poolmon to see how I am running out of NonPaged memory and who is the culprit also this would tell me the Tag for the Jungo driver since I know the amount of memory I am allocating (8 Mb). Here is the strange part. According to the Poolmon no one is allocating 8Mb memory and there is plenty of Paged and NonPaged memory at the time AllocateCommonBuffer fails.
Now, I can hypothesize all kind of scenarios as to why the allocation fails. For example, maybe it needs something like NonPaged + Contiguous therefore it runs out of this flavor of memory or something. But I am not convinced by this kind of arguments since I do not have any way of verification of my hypothesis. I think the question I would like to ask is this : When I allocate 8Mb memory successfully with AllocateCommonBuffer where does the memory come from since I do not see anywhere Paged or NonPaged resources being reduced by this amount? Only indication of the allocation successful return of AllocateCommonBuffer and System PTE increased 2048 entries.
For those of you who have suggestions. I thank you for your time and attention.
Pushing the Limits of Windows: Processes and Threads
This is the fourth post in my Pushing the Limits of Windows series that explores the boundaries of fundamental resources in Windows. This time, I’m going to discuss the limits on the maximum number of threads and processes supported on Windows. I’ll briefly describe the difference between a thread and a process, survey thread limits and then investigate process limits. I cover thread limits first since every active process has at least one thread (a process that’s terminated, but is kept referenced by a handle owned by another process won’t have any), so the limit on processes is directly affected by the caps that limit threads.
Unlike some UNIX variants, most resources in Windows have no fixed upper bound compiled into the operating system, but rather derive their limits based on basic operating system resources that I’ve already covered. Process and threads, for example, require physical memory, virtual memory, and pool memory, so the number of processes or threads that can be created on a given Windows system is ultimately determined by one of these resources, depending on the way that the processes or threads are created and which constraint is hit first. I therefore recommend that you read the preceding posts if you haven’t, because I’ll be referring to reserved memory, committed memory, the system commit limit and other concepts I’ve covered. Here’s the index of the entire Pushing the Limits series. While they can stand on their own, they assume that you read them in order.
Pushing the Limits of Windows: Physical Memory
Pushing the Limits of Windows: Virtual Memory
Pushing the Limits of Windows: Paged and Nonpaged Pool
Pushing the Limits of Windows: Processes and Threads
Pushing the Limits of Windows: Handles
Pushing the Limits of Windows: USER and GDI Objects – Part 1
Pushing the Limits of Windows: USER and GDI Objects – Part 2
Processes and Threads
A Windows process is essentially container that hosts the execution of an executable image file. It is represented with a kernel process object and Windows uses the process object and its associated data structures to store and track information about the image’s execution. For example, a process has a virtual address space that holds the process’s private and shared data and into which the executable image and its associated DLLs are mapped. Windows records the process’s use of resources for accounting and query by diagnostic tools and it registers the process’s references to operating system objects in the process’s handle table. Processes operate with a security context, called a token, that identifies the user account, account groups, and privileges assigned to the process.
Finally, a process includes one or more threads that actually execute the code in the process (technically, processes don’t run, threads do) and that are represented with kernel thread objects. There are several reasons applications create threads in addition to their default initial thread: processes with a user interface typically create threads to execute work so that the main thread remains responsive to user input and windowing commands; applications that want to take advantage of multiple processors for scalability or that want to continue executing while threads are tied up waiting for synchronous I/O operations to complete also benefit from multiple threads.
Thread Limits
Besides basic information about a thread, including its CPU register state, scheduling priority, and resource usage accounting, every thread has a portion of the process address space assigned to it, called a stack, which the thread can use as scratch storage as it executes program code to pass function parameters, maintain local variables, and save function return addresses. So that the system’s virtual memory isn’t unnecessarily wasted, only part of the stack is initially allocated, or committed and the rest is simply reserved. Because stacks grow downward in memory, the system places guard pages beyond the committed part of the stack that trigger an automatic commitment of additional memory (called a stack expansion) when accessed. This figure shows how a stack’s committed region grows down and the guard page moves when the stack expands, with a 32-bit address space as an example (not drawn to scale):

The Portable Executable (PE) structures of the executable image specify the amount of address space reserved and initially committed for a thread’s stack. The linker defaults to a reserve of 1MB and commit of one page (4K), but developers can override these values either by changing the PE values when they link their program or for an individual thread in a call to CreateThread. You can use a tool like Dumpbin that comes with Visual Studio to look at the settings for an executable. Here’s the Dumpbin output with the /headers option for the executable generated by a new Visual Studio project:

Converting the numbers from hexadecimal, you can see the stack reserve size is 1MB and the initial commit is 4K and using the new Sysinternals VMMap tool to attach to this process and view its address space, you can clearly see a thread stack’s initial committed page, a guard page, and the rest of the reserved stack memory:

Because each thread consumes part of a process’s address space, processes have a basic limit on the number of threads they can create that’s imposed by the size of their address space divided by the thread stack size.
32-bit Thread Limits
Even if the thread had no code or data and the entire address space could be used for stacks, a 32-bit process with the default 2GB address space could create at most 2,048 threads. Here’s the output of the Testlimit tool running on 32-bit Windows with the –t switch (create threads) confirming that limit:

Again, since part of the address space was already used by the code and initial heap, not all of the 2GB was available for thread stacks, thus the total threads created could not quite reach the theoretical limit of 2,048.
I linked the Testlimit executable with the large address space-aware option, meaning that if it’s presented with more than 2GB of address space (for example on 32-bit systems booted with the /3GB or /USERVA Boot.ini option or its equivalent BCD option on Vista and later increaseuserva), it will use it. 32-bit processes are given 4GB of address space when they run on 64-bit Windows, so how many threads can the 32-bit Testlimit create when run on 64-bit Windows? Based on what we’ve covered so far, the answer should be roughly 4096 (4GB divided by 1MB), but the number is actually significantly smaller. Here’s 32-bit Testlimit running on 64-bit Windows XP:

The reason for the discrepancy comes from the fact that when you run a 32-bit application on 64-bit Windows, it is actually a 64-bit process that executes 64-bit code on behalf of the 32-bit threads, and therefore there is a 64-bit thread stack and a 32-bit thread stack area reserved for each thread. The 64-bit stack has a reserve of 256K (except that on systems prior to Vista, the initial thread’s 64-bit stack is 1MB). Because every 32-bit thread begins its life in 64-bit mode and the stack space it uses when starting exceeds a page, you’ll typically see at least 16KB of the 64-bit stack committed. Here’s an example of a 32-bit thread’s 64-bit and 32-bit stacks (the one labeled “Wow64” is the 32-bit stack):

32-bit Testlimit was able to create 3,204 threads on 64-bit Windows, which given that each thread uses 1MB+256K of address space for stack (again, except the first on versions of Windows prior to Vista, which uses 1MB+1MB), is exactly what you’d expect. I got different results when I ran 32-bit Testlimit on 64-bit Windows 7, however:

The difference between the Windows XP result and the Windows 7 result is caused by the more random nature of address space layout introduced in Windows Vista, Address Space Load Randomization (ASLR), that leads to some fragmentation. Randomization of DLL loading, thread stack and heap placement, helps defend against malware code injection. As you can see from this VMMap output, there’s 357MB of address space still available, but the largest free block is only 128K in size, which is smaller than the 1MB required for a 32-bit stack:

As I mentioned, a developer can override the default stack reserve. One reason to do so is to avoid wasting address space when a thread’s stack usage will always be significantly less than the default 1MB. Testlimit sets the default stack reservation in its PE image to 64K and when you include the –n switch along with the –t switch, Testlimit creates threads with 64K stacks. Here’s the output on a 32-bit Windows XP system with 256MB RAM (I did this experiment on a small system to highlight this particular limit):

Note the different error, which implies that address space isn’t the issue here. In fact, 64K stacks should allow for around 32,000 threads (2GB/64K = 32,768). What’s the limit that’s being hit in this case? A look at the likely candidates, including commit and pool, don’t give any clues, as they’re all below their limits:

It’s only a look at additional memory information in the kernel debugger that reveals the threshold that’s being hit, resident available memory, which has been exhausted:

Resident available memory is the physical memory that can be assigned to data or code that must be kept in RAM. Nonpaged pool and nonpaged drivers count against it, for example, as does memory that’s locked in RAM for device I/O operations. Every thread has both a user-mode stack, which is what I’ve been talking about, but they also have a kernel-mode stack that’s used when they run in kernel mode, for example while executing system calls. When a thread is active its kernel stack is locked in memory so that the thread can execute code in the kernel that can’t page fault.
A basic kernel stack is 12K on 32-bit Windows and 24K on 64-bit Windows. 14,225 threads require about 170MB of resident available memory, which corresponds to exactly how much is free on this system when Testlimit isn’t running:

Once the resident available memory limit is hit, many basic operations begin failing. For example, here’s the error I got when I double-clicked on the desktop’s Internet Explorer shortcut:

As expected, when run on 64-bit Windows with 256MB of RAM, Testlimit is only able to create 6,600 threads – roughly half what it created on 32-bit Windows with 256MB RAM - before running out of resident available memory:

The reason I said “basic” kernel stack earlier is that a thread that executes graphics or windowing functions gets a “large” stack when it executes the first call that’s 20K on 32-bit Windows and 48K on 64-bit Windows. Testlimit’s threads don’t call any such APIs, so they have basic kernel stacks.
64-bit Thread Limits
Like 32-bit threads, 64-bit threads also have a default of 1MB reserved for stack, but 64-bit processes have a much larger user-mode address space (8TB), so address space shouldn’t be an issue when it comes to creating large numbers of threads. Resident available memory is obviously still a potential limiter, though. The 64-bit version of Testlimit (Testlimit64.exe) was able to create around 6,600 threads with and without the –n switch on the 256MB 64-bit Windows XP system, the same number that the 32-bit version created, because it also hit the resident available memory limit. However, on a system with 2GB of RAM, Testlimit64 was able to create only 55,000 threads, far below the number it should have been able to if resident available memory was the limiter (2GB/24K = 89,000):

In this case, it’s the initial thread stack commit that causes the system to run out of virtual memory and the “paging file is too small” error. Once the commit level reached the size of RAM, the rate of thread creation slowed to a crawl because the system started thrashing, paging out stacks of threads created earlier to make room for the stacks of new threads, and the paging file had to expand. The results are the same when the –n switch is specified, because the threads have the same initial stack commitment.
Process Limits
The number of processes that Windows supports obviously must be less than the number of threads, since each process has one thread and a process itself causes additional resource usage. 32-bit Testlimit running on a 2GB 64-bit Windows XP system created about 8,400 processes:

A look in the kernel debugger shows that it hit the resident available memory limit:

If the only cost of a process with respect to resident available memory was the kernel-mode thread stack, Testlimit would have been able to create far more than 8,400 threads on a 2GB system. The amount of resident available memory on this system when Testlimit isn’t running is 1.9GB:

Dividing the amount of resident memory Testlimit used (1.9GB) by the number of processes it created (8,400) yields 230K of resident memory per process. Since a 64-bit kernel stack is 24K, that leaves about 206K unaccounted for. Where’s the rest of the cost coming from? When a process is created, Windows reserves enough physical memory to accommodate the process’s minimum working set size. This acts as a guarantee to the process that no matter what, there will enough physical memory available to hold enough data to satisfy its minimum working set. The default working set size happens to be 200KB, a fact that’s evident when you add the Minimum Working Set column to Process Explorer’s display:

The remaining roughly 6K is resident available memory charged for additional non-pageable memory allocated to represent a process. A process on 32-bit Windows will use slightly less resident memory because its kernel-mode thread stack is smaller.
As they can for user-mode thread stacks, processes can override their default working set size with the SetProcessWorkingSetSize function. Testlimit supports a –n switch, that when combined with –p, causes child processes of the main Testlimit process to set their working set to the minimum possible, which is 80K. Because the child processes must run to shrink their working sets, Testlimit sleeps after it can’t create any more processes and then tries again to give its children a chance to execute. Testlimit executed with the –n switch on a Windows 7 system with 4GB of RAM hit a limit other than resident available memory: the system commit limit:

Here you can see the kernel debugger reporting not only that the system commit limit had been hit, but that there have been thousands of memory allocation failures, both virtual and paged pool allocations, following the exhaustion of the commit limit (the system commit limit was actually hit several times as the paging file was filled and then grown to raise the limit):

The baseline commitment before Testlimit ran was about 1.5GB, so the threads had consumed about 8GB of committed memory. Each process therefore consumed roughly 8GB/6,600, or 1.2MB. The output of the kernel debugger’s !vm command, which shows the private memory allocated by each active process, confirms that calculation:

The initial thread stack commitment, described earlier, has a negligible impact with the rest coming from the memory required for the process address space data structures, page table entries, the handle table, process and thread objects, and private data the process creates when it initializes.
How Many Threads and Processes are Enough?
So the answer to the questions, “how many threads does Windows support?” and “how many processes can you run concurrently on Windows?” depends. In addition to the nuances of the way that the threads specify their stack sizes and processes specify their minimum working sets, the two major factors that determine the answer on any particular system include the amount of physical memory and the system commit limit. In any case, applications that create enough threads or processes to get anywhere near these limits should rethink their design, as there are almost always alternate ways to accomplish the same goals with a reasonable number. For instance, the general goal for a scalable application is to keep the number of threads running equal to the number of CPUs (with NUMA changing this to consider CPUs per node) and one way to achieve that is to switch from using synchronous I/O to using asynchronous I/O and rely on I/O completion ports to help match the number of running threads to the number of CPUs.
Comments
- Mark RussinovichJanuary 1, 2003
@mlynch
Ah, I see, sorry! It was a typo. Fixed.
- Mark RussinovichJanuary 1, 2003
@Tony:
Good catch, I've fixed the text. ASLR in Vista originally stood for Address Space Load Randomization, so I accidentally use that sometimes.
- Mark RussinovichJanuary 1, 2003
I don't see that. Email me the .mmp file and I'll take a look.
- Mark RussinovichJanuary 1, 2003
@Ross Presser:
Take a look in VMMap at the stack reserves.
- Mark RussinovichJanuary 1, 2003
@Raymond: good point, you'll see that if the last thread in the process exits, but an application has a handle open to the process or a driver has a reference to the process object.
- Mark RussinovichJanuary 1, 2003
@mingbo wan:
No, because a 32-bit thread has both 32-bit and 64-bit stack reserves.
-
Sanket PatelJuly 9, 2009
Hi Mark, I am looking at a VMMap snap of Notepad.exe on Win7 x64, and I am seeing a "Thread Stack (Wow64)" with a commit of 224K. Why does a 64-bit process have a Wow64 stack?
-
James BrayJuly 9, 2009
Great article.
I love the VMMap utility too. I'm a software developer myself, and the system I help maintain runs under Interix (SUA/SFU). We were having a problem recently whereby one of our applications was vaporizing under heavy load. We finally discovered that it was running out of stack space because, under Interix, the maximum stack size *is* hardcoded (possibly a GCC thing). I just reran our application using VMMap and it shows the stack growing from ~100K to 16MB. I only wish we'd had this utility then :-)
James
-
AnonymousJuly 9, 2009The comment has been removed
-
Ross PresserJuly 9, 2009
Yesterday I posted a comment showing that my Windows XP 32-bit system, running on a 64-bit capable processor but installed as 32-bit Windows XP, not booted with the /3GB or any other special switch, but with 3GB of RAM, can produce over 50,000 threads with "testlimit -t" (no -n). That comment has not shown up here. What's the explanation?
-
vadmystJuly 10, 2009
zizebra,
I sometimes get the an error about low virtual memory, do you mean that kind of warnings/alerts?
However it would be nice to have a built-in tool that could somehow report status of particular resources on Windows.
For instance, CPU is over 80% or available memory is low for considerable amount of time - issue warning
-
Andrei VolkovJuly 10, 2009
I wonder what's the limit on the number of fibers? Like say if I want to use a fiber per each concurrent user session of my web app...
-
AnonymousJuly 10, 2009The comment has been removed
- tonyJuly 10, 2009
I always thought that ASLR stands for "Address Space Layout Randomization" not "Address Space Load Randomization".
-
mingbo wanJuly 10, 2009
The 64-bit stack has a reserve of 256MB (except that on systems prior to Vista, the initial thread’s 64-bit stack is 1MB).
32-bit Testlimit was able to create 3,204 threads on 64-bit Windows, which given that each thread uses 1MB+256MB of address space for stack
should be 256KB?
July 10, 2009
I just want to make sure you understood what mingbo wan is saying, because I'm confused as well:
"The 64-bit stack has a reserve of *256MB* (except that on systems prior to Vista, the initial thread’s 64-bit stack is 1MB)."
...
"32-bit Testlimit was able to create 3,204 threads on 64-bit Windows, which given that each thread uses *1MB+256MB* of address space for stack (again, except the first on versions of Windows prior to Vista, which uses 1MB+1MB), is exactly what you’d expect."
mingbo wan was saying that these should read 256 *kilobytes* not megabytes. If you wrote MB deliberately, then I'm a bit confused because your accompanying VMMap output shows the 64-bit thread stack as 256 KB and mathematically 256 MB doesn't add up.
3,204 threads * (1 MB + 256 MB stack) = 813 GB address space
whereas
3,204 threads * (1 MB + 256 KB stack) = 4,005 MB = ~ 4 GB address space
Which is roughly the expected address space size of a 32-bit process on 64-bit Windows. Is it really not a typo?
Pushing the Limits of Windows: Handles
This is the fifth post in my Pushing the Limits of Windows series where I explore the upper bound on the number and size of resources that Windows manages, such as physical memory, virtual memory, processes and threads. Here’s the index of the entire Pushing the Limits series. While they can stand on their own, they assume that you read them in order.
Pushing the Limits of Windows: Physical Memory
Pushing the Limits of Windows: Virtual Memory
Pushing the Limits of Windows: Paged and Nonpaged Pool
Pushing the Limits of Windows: Processes and Threads
Pushing the Limits of Windows: Handles
Pushing the Limits of Windows: USER and GDI Objects – Part 1
Pushing the Limits of Windows: USER and GDI Objects – Part 2
This time I’m going to go inside the implementation of handles to find and explain their limits. Handles are data structures that represent open instances of basic operating system objects applications interact with, such as files, registry keys, synchronization primitives, and shared memory. There are two limits related to the number of handles a process can create: the maximum number of handles the system sets for a process and the amount of memory available to store the handles and the objects the application is referencing with its handles.
In most cases the limits on handles are far beyond what typical applications or a system ever use. However, applications not designed with the limits in mind may push them in ways their developers don’t anticipate. A more common class of problems arise because the lifetime of these resources must be managed by applications and, just like for virtual memory, resource lifetime management is challenging even for the best developers. An application that fails to release unneeded resources causes a leak of the resource that can ultimately cause a limit to be hit, resulting in bizarre and difficult to diagnose behaviors for the application, other applications or the system in general.
As always, I recommend you read the previous posts because they explain some of the concepts this post references, like paged pool.
Handles and Objects
The kernel-mode core of Windows, which is implemented in the %SystemRoot%\System32\Ntoskrnl.exe image, consists of various subsystems such as the Memory Manager, Process Manager, I/O Manager, Configuration Manager (registry), which are all parts of the Executive. Each of these subsystems defines one or more types with the Object Manager to represent the resources they expose to applications. For example, the Configuration Manager defines the key object to represent an open registry key; the memory manager defines the Section object for shared memory; the Executive defines Semaphore, Mutant (the internal name for a mutex), and Event synchronization objects (these objects wrap fundamental data structures defined by the operating system’s Kernel subsystem); the I/O Manager defines the File object to represent open instances of device driver resources, which include file system files; and the Process Manager the creates Thread and Process objects I discussed in my last Pushing the Limits post. Every release of Windows introduces new object types with Windows 7 defining a total of 42. You can see the objects defined by running the Sysinternals Winobj utility with administrative rights and navigating to the ObjectTypes directory in the Object Manager namespace:

When an application wants to manage one of these resources it first must call the appropriate API to create or open the resource. For instance, the CreateFile function opens or creates a file, the RegOpenKeyEx function opens a registry key, and the CreateSemaphoreEx function opens or creates a semaphore. If the function succeeds, Windows allocates a handle in the handle table of the application’s process and returns the handle value, which applications treat as opaque but that is actually the index of the returned handle in the handle table.
With the handle in hand, the application then queries or manipulates the object by passing the handle value to subsequent API functions like ReadFile, SetEvent, SetThreadPriority, and MapViewOfFile. The system can look up the object the handle refers to by indexing into the handle table to locate the corresponding handle entry, which contains a pointer to the object. The handle entry also stores the accesses the process was granted at the time it opened the object, which enables the system to make sure it doesn’t allow the process to perform an operation on the object for which it didn’t ask permission. For example, if the process successfully opened a file for read access, the handle entry would look like this:

If the process tried to write to the file, the function would fail because the access hadn’t been granted and the cached read access means that the system doesn’t have to execute a more expensive access-check again.
Maximum Number of Handles
You can explore the first limit with the Testlimit tool I’ve been using in this series to empirically explore limits. It’s available for download on the Windows Internals book page here. To test the number of handles a process can create, Testlimit implements the –h switch that directs it to create as many handles as possible. It does so by creating an event object with CreateEvent and then repeatedly duplicating the handle the system returns using DuplicateHandle. By duplicating the handle, Testlimit avoids creating new events and the only resources it consumes are those for the handle table entries. Here’s the result of Testlimit with the –h option on a 64-bit system:

The result doesn’t represent the total number of handles a process can create, however, because system DLLs open various objects during process initialization. You see a process’s total handle count by adding a handle count column to Task Manager or Process Explorer. The total shown for Testlimit in this case is 16,711,680:

When you run Testlimit on a 32-bit system, the number of handles it can create is slightly different:

Its total handle count is also different, 16,744,448:

Where do the differences come from? The answer lies in the way that the Executive, which is responsible for managing handle tables, sets the per-process handle limit, as well as the size of a handle table entry. In one of the rare cases where Windows sets a hard-coded upper limit on a resource, the Executive defines 16,777,216 (16*1024*1024) as the maximum number of handles a process can allocate. Any process that has more than a ten thousand handles open at any given point in time is likely either poorly designed or has a handle leak, so a limit of 16 million is essentially infinite and can simply help prevent a process with a leak from impacting the rest of the system. Understanding why the numbers Task Manager shows don’t equal the hard-coded maximum requires a look at the way the Executive organizes handle tables.
A handle table entry must be large enough to store the granted-access mask and an object pointer. The access mask is 32-bits, but the pointer size obviously depends on whether it’s a 32-bit or 64-bit system. Thus, a handle entry is 8-bytes on 32-bit Windows and 12-bytes on 64-bit Windows. 64-bit Windows aligns the handle entry data structure on 64-bit boundaries, so a 64-bit handle entry actually consumes 16-bytes. Here’s the definition for a handle entry on 64-bit Windows, as shown in a kernel debugger using the dt (dump type) command:

The output reveals that the structure is actually a union that can sometimes store information other than an object pointer and access mask, but those two fields are highlighted.
The Executive allocates handle tables on demand in page-sized blocks that it divides into handle table entries. That means a page, which is 4096 bytes on both x86 and x64, can store 512 entries on 32-bit Windows and 256 entries on 64-bit Windows. The Executive determines the maximum number of pages to allocate for handle entries by dividing the hard-coded maximum,16,777,216, by the number of handle entries in a page, which results on 32-bit Windows to 32,768 and on 64-bit Windows to 65,536. Because the Executive uses the first entry of each page for its own tracking information, the number of handles available to a process is actually 16,777,216 minus those numbers, which explains the results obtained by Testlimit: 16,777,216-65,536 is 16,711,680 and 16,777,216-65,536-32,768 is 16,744,448.
Handles and Paged Pool
The second limit affecting handles is the amount of memory required to store handle tables, which the Executive allocates from paged pool. The Executive uses a three-level scheme, similar to the way that processor Memory Management Units (MMUs) manage virtual to physical address translations, to keep track of the handle table pages that it allocates. We’ve already seen the organization of the lowest and mid levels, which store actual handle table entries. The top level serves as pointers into the mid-level tables and includes 1024 entries per-page on 32-bit Windows. The total number of pages required to store the maximum number of handles can therefore be calculated for 32-bit Windows as 16,777,216/512*4096, which is 128MB. That’s consistent with the paged pool usage of Testlimit as shown in Task Manager:

On 64-bit Windows, there are 256 pointers in a page of top-level pointers. That means the total paged pool usage for a full handle table is 16,777,216/256*4096, which is 256MB. A look at Testlimit’s paged pool usage on 64-bit Windows confirms the calculation:

Paged pool is generally large enough to more than accommodate those sizes, but as I stated earlier, a process that creates that many handles is almost certainly going to exhaust other resources, and if it reaches the per-process handle limit it will probably fail itself because it can’t open any other objects.
Handle Leaks
A handle leaker will have a handle count that rises over time. The reason that a handle leak is so insidious is that unlike the handles Testlimit creates, which all point to the same object, a process leaking handles is probably leaking objects as well. For example, if a process creates events but fails to close them, it will leak both handle entries and event objects. Event objects consume nonpaged pool, so the leak will impact nonpaged pool in addition to paged pool.
You can graphically spot the objects a process is leaking using Process Explorer’s handle view because it highlights new handles in green and closed handles in red; if you see lots of green with infrequent red then you might be seeing a leak. You can watch Process Explorer’s handle highlighting in action by opening a Command Prompt process, selecting the process in Process Explorer, opening the handle-view lower pane and then changing directory in the Command Prompt. The old working directory’s handle will highlight in red and the new one in green:

By default, Process Explorer only shows handles that reference objects that have names, which means that you won’t see all the handles a process is using unless you select Show Unnamed Handles and Mappings from the View menu. Here are some of the unnamed handles in Command Prompt’s handle table:

Just like most bugs, only the developer of the code that’s leaking can fix it. If you spot a leak in a process that can host multiple components or extensions, like Explorer, a Service Host or Internet Explorer, then the question is what component is the one responsible for the leak. Figuring that out might enable you to avoid the problem by disabling or uninstalling the problematic extension, fix the problem by checking for an update, or report the bug to the vendor.
Fortunately, Windows includes a handle tracing facility that you can use to help identify leaks and the responsible software. It’s enabled on a per-process basis and when active causes the Executive to record a stack trace at the time every handle is created or closed. You can enable it either by using the Application Verifier, a free download from Microsoft, or by using the Windows Debugger (Windbg). You should use the Application Verifier if you want the system to track a process’s handle activity from when it starts. In either case, you’ll need to use a debugger and the !htrace debugger command to view the trace information.
To demonstrate the tracing in action, I launched Windbg and attached to the Command Prompt I had opened earlier. I then executed the !htrace command with the -enable switch to turn on handle tracing:

I let the process’s execution continue and changed directory again. Then I switched back to Windbg, stopped the process’s execution, and executed htrace without any options, which has it list all the open and close operations the process executed since the previous !htrace snapshot (created with the –snapshot option) or from when handle tracing was enabled. Here’s the output of the command for the same session:

The events are printed from most recent operation to least, so reading from the bottom, Command Prompt opened handle 0xb8, then closed it, next opened handle 0x22c, and finally closed handle 0xec. Process Explorer would show handle 0x22c in green and 0xec in red if it was refreshed after the directory change, but probably wouldn’t see 0xb8 unless it happened to refresh between the open and close of that handle. The stack for 0x22c’s open reveals that it was the result of Command Prompt (cmd.exe) executing its ChangeDirectory function. Adding the handle value column to Process Explorer confirms that the new handle is 0x22c:

If you’re just looking for leaks, you should use !htrace with the –diff switch, which has it show only new handles since the last snapshot or start of tracing. Executing that command shows just handle 0x22c, as expected:

Finally, a great video that presents more tips for debugging handle leaks is this Channel 9 interview with Jeff Dailey, a Microsoft Escalation Engineer that debugs them for a living: https://channel9.msdn.com/posts/jeff_dailey/Understanding-handle-leaks-and-how-to-use-htrace-to-find-them/
Next time I’ll look at limits for a couple of other handle-based resources, GDI Object and USER Objects. Handles to those resources are managed by the Windows subsystem, not the Executive, so use different resources and have different limits.
Comments
Pushing the Limits of Windows: USER and GDI Objects – Part 1
So far in the Pushing the Limits of Windows series, I’ve focused on resources managed by the Windows operating system kernel, including physical and virtual memory, paged and nonpaged pool, processes, threads and handles. In this and the next post, however, I will explore two resources managed by the Windows window manager, USER and GDI objects, that represent window elements (like windows and menus) and graphics constructs (like pens, brushes and drawing surfaces). Just like for the other resources I’ve discussed in previous posts, exhausting the various USER and GDI resource limits can lead to unpredictable behavior, including application failures and an unusable system.
As always, I recommend you read the previous posts before this one, because some of the limits related to USER and GDI resources are based on limits I’ve covered. Here’s a full index of my other Pushing the Limits of Windows posts:
Pushing the Limits of Windows: Physical Memory
Pushing the Limits of Windows: Virtual Memory
Pushing the Limits of Windows: Paged and Nonpaged Pool
Sessions, Window Stations and Desktops
There are a few concepts that make the relationship between USER objects, GDI objects, and the system more clear. The first is the session. A session represents an interactive user logon that has its own keyboard, mouse and display and represents both a security and resource boundary.
The session concept was first introduced with Terminal Services (now called Remote Desktop Services) in Windows NT 4 Terminal Server Edition, where the physical display, keyboard and mouse concepts were virtualized for each user interactively logging on to a system remotely, and core Terminal Services functionality was built into Windows 2000 Server. In Windows XP, sessions were leveraged to create the Fast User Switching (FUS) feature that allows you to switch between multiple interactive logins on the same physical display, keyboard and mouse.
Thus, a session can be connected with the physical display and input devices attached to the system, connected with a logical display and input devices like ones presented by a Remote Desktop client application, or be in a disconnected state like exists when you switch away from a session with Fast User Switching or terminate a Remote Desktop Client connection without logging off the session.
Every process is uniquely associated with a specific session, which you can see when you add the Session column to Sysinternals Process Explorer. This screenshot, in which I’ve collapsed the process tree to show only processes that have no parent, is from a Remote Desktop Services (RDS – formerly Terminal Server Services) system that has four active sessions: session 0 is the dedicated session in which system processes execute on Windows Vista and higher; session 1 is the session in which I’m writing this post; Session 2 is the session of another user account that I’m concurrently logged into from another system; and finally, session 3 is one that Remote Desktop Services proactively created to be ready for the next interactive logon:

Since every process is associated with a specific session and the operating system usually only needs access to the session-specific data of the current process’s session, Windows defines a view into a process’s session data in the process’s virtual address space. Thus, when the system switches between threads of different processes, it also switches address spaces, switching the current session view. When the Csrss.exe process of Session 0 is the current process, for example, the address space mappings include the system address space (which is included in every process’s address space), Csrss’s address space, and the Session 0 address space. The region of memory mapping a session’s data is known as Session View Space or Session Space. When the system switches to a thread from Session 1’s Explorer process, the mappings change accordingly, and when it switches to a thread from Notepad, the Session 1 Session Space remains mapped:

Note that the figure isn’t exactly correct for 32-bit Windows Vista and higher, since dynamic system address space means that the Session Space isn’t necessarily contiguous and can grow and shrink as required on those systems.
The next concept is the desktop, an object defined by the window manager to represent a virtual display that includes the windows associated with the desktop (note that this is different than Explorer’s definition of a desktop, which is the user’s directory with shortcuts and other objects the user places there). The default desktop is named “Default”, but applications can create additional desktops and switch the connection to the logical display, something the Sysinternals Desktops utility uses to create up to four virtual desktops a user can switch between.
Finally, to support multiple virtual displays that are associated with the same window manager instance, the window manager defines the window station object. A window station is associated with a particular session and a session can have multiple window stations, but each session has only one interactive window station, called Winsta0, that can connect with a physical or logical display, keyboard and mouse; the other window stations are essentially “headless” and support for them exists solely to isolate processes that expect window manager services, but that shouldn’t. For example, the system creates non-interactive window stations for each service account with which it associates processes running in the account, since Windows services should not display user-interfaces.
You can see the window stations associated with Session 0 by looking in the Object Manager namespace under the \Windows directory using the Sysinternals Winobj tool (viewing the directory requires running elevated with administrative privileges). Here you can see that a window station the Microsoft Windows Search Service creates to run search filters in, window stations for each of the three built-in service accounts (System, Network Service and Local Service), and Session 0’s interactive window station:

You can see the window stations associated with other sessions in the Sessions directory in the Object Manager namespace. Here’s the only window station, the interactive WinSta0 window station, associated with my logon session:

This diagram shows the relationship between sessions, window stations, and desktops for a system that has one user logged into Session1 on the physical console and another logged on to Session 2 via a remote desktop connection where the user has run a virtual desktops utility and switched the display to Desktop1.

Besides having an association with a particular session, processes are associated with a specific window station and desktop, though processes can switch between both and threads can switch between desktops. Thus, every process’s association can be represented with a hierarchical path like this: “Session 1\WinSta0\Default”. You can in most cases indirectly determine what window station and desktop a process is connected to by looking at its handle table in Process Explorer’s handle view to see the names of the objects it has open. This screen shots of the handle table of an Explorer process show that it is connected to the Default desktop on WinSta0 of Session 1:

User Objects
With the fundamental concepts in hand, let’s turn our attention first to USER objects. USER objects get their name from the fact that they represent user interface elements like desktops, windows, menus, cursors, icons, and accelerator tables (menu keyboard shortcuts). Despite the fact that USER objects are associated with a specific desktop, they must be accessible from all the desktops of a session, for example to allow a process on one desktop to register for a hotkey that can be entered on any of them. For that reason, the window manager assigns USER object identifiers that are scoped to a window station.
A basic limitation imposed by the window manager is that no process can create more than 10,000 USER objects. That limitation attempts to prevent a single process from exhausting the resources associated with USER objects, either because it’s programmed with algorithms that can create excessive number of objects or because it leaks objects by allocating them and not deleting them when it’s through using them. You can easily verify this limit by running the Sysinternals Testlimit utility with the –u switch, which directs Testlimit to create as many USER objects as it can:

The window manager keeps track of how many USER objects a process allocates, which you can see when you add the USER Objects column to Process Explorer’s display, so that you can keep tabs on the number of objects processes allocate. This screenshot shows that, as expected, Windows system processes, including Lsass.exe (the Local Security Authority Subsystem) and service processes like Svchost, don’t allocate USER objects because they have no user interface:

Process Explorer shows the number of USER objects a process has allocated on the Performance page of a process’s process properties dialog:

One fundamental limitation on the number of USER objects comes from the fact that their identifiers were 16-bit values in the first versions of Windows, which were 16-bit. When 32-bit support was added in later versions, USER identifiers had to remain restricted to 16-bit values so that 16-bit processes could interact with windows and other USER objects created by 32-bit processes. Thus, 65,535 (2^16) is the limit on the total number of USER objects that can be created on a session (and for historical reasons, windows must have even-numbered identifiers, so there can be a maximum of 32,768 windows per session). You can verify this limit by running multiple copies of Testlimit with the –u switch until you can’t create any more. Assuming the processes you already have running aren’t using an excessive number of objects, you should be able to run 7 copies, where the first 6 allocate 10,000 objects and the last allocates the difference between the number of already allocated objects and 65,535:

Be sure that you’re prepared to hard power-off your system when you do this because the desktop may become unusable. Many operations, like even opening the start menu’s shutdown menu, require USER objects, and when no more can be allocated the system will behave in bizarre ways. I wasn’t even able to terminate a Notepad process I had running by clicking on its close menu button after USER objects had been exhausted.
So far I’ve talked only about the limits associated with absolute number of USER objects a process or window station can allocate, but there are other limits caused by the storage used for the USER objects themselves. Each desktop has its own region of memory, called the desktop heap, from which most USER objects created on the desktop are allocated. Because desktop heaps are stored in Session Space and 32-bit address spaces limit the amount of kernel-mode address space, the sizes of desktop heaps are capped at a relatively modest amount. They also vary in size depending on the type of desktop they are for and whether the system is a 32-bit or 64-bit system.
Matthew Justice’s Desktop Heap Overview and Desktop Heap, Part 2 articles from the NT Debugging Blog do an excellent job of documenting desktop heap sizes up through Windows Vista SP1. This table summarizes the sizes across Windows versions up through Windows Server 2008 R2:
| Interactive Desktop | Non-Interactive Desktop | Winlogon Desktop | Disconnect Desktop | |
| Windows XP 32-bit | 3 MB | 512 KB | 128 KB | 64 KB |
| Windows Server 2003 32-bit | 3 MB | 512 KB | 128 KB | 64 KB |
| Windows Server 2003 64-bit | 20 MB | 768 KB | 192 KB | 96 KB |
| Windows Vista/Windows Server 2008 32-bit | 12 MB | 512 KB | 128 KB | 64 KB |
| Windows Vista/Windows Server 2008 64-bit | 20 MB | 768 KB | 192 KB | 96 KB |
| Windows 7 32-bit | 12 MB | 512 KB | 128 KB | 64 KB |
| Windows 7/Windows Server 2008 R2 64-bit | 20 MB | 768 KB | 192 KB | 96 KB |
It’s worth noting that the original release of Windows Vista 32-bit had the 3 MB Interactive Heap size that previous 32-bit versions of Windows had. After the release our telemetry showed us that some users occasionally ran out of heap, presumably because they were running more applications on systems that had more memory, so SP1 raised the size to 12 MB. It’s also possible to override the default desktop heap sizes with registry settings described in Matthew’s article.
On versions of Windows prior to Windows Vista, you can use the Microsoft Desktop Heap Monitor tool to view the sizes of the Desktop Heaps and how much of each is in use. Here’s the output of the tool on a 32-bit Windows XP system showing that only 5.6% of heap (172 KB) on the interactive desktop, Default, has been consumed:

The tool hasn’t been updated for Windows Vista because the larger desktop heap sizes on newer versions of Windows mean that desktop heap is rarely exhausted before other USER object limits are hit. However, you can use Testlimit with the –u and –i switches to see how the system behaves when interactive desktop heap exhaustion occurs. The switch combination has Testlimit create window class data structures that have 4 KB of extra class storage until it fails. Here’s the output of Testlimit when run immediately after I captured the above Desktop Heap Monitor output. 2823 KB plus the 172 KB that Desktop Heap Monitor said was already allocated equals about 3 MB:

Though there’s no way to determine how much heap is in use on newer systems, the window manager writes an event to the system event log when there’s heap exhaustion that can help troubleshoot window manager issues:

That covers USER object limits. Stay tuned for Part 2, where I’ll discuss the limits related to window manager GDI objects.
Pushing the Limits of Windows: USER and GDI Objects – Part 2
Last time, I covered the limits and how to measure usage of one of the two key window manager resources, USER objects. This time, I’m going to cover the other key resource, GDI objects. As always, I recommend you read the previous posts before this one, because some of the limits related to USER and GDI resources are based on limits I’ve covered. Here’s a full index of my other Pushing the Limits of Windows posts:
Pushing the Limits of Windows: Physical Memory
Pushing the Limits of Windows: Virtual Memory
Pushing the Limits of Windows: Paged and Nonpaged Pool
Pushing the Limits of Windows: Processes and Threads
Pushing the Limits of Windows: Handles
Pushing the Limits of Windows: USER and GDI Objects – Part 1
GDI Objects
GDI objects represent graphical device interface resources like fonts, bitmaps, brushes, pens, and device contexts (drawing surfaces). As it does for USER objects, the window manager limits processes to at most 10,000 GDI objects, which you can verify with Testlimit using the –g switch:

You can look at an individual process’s GDI object usage on the Performance page of its Process Explorer process properties dialog and add the GDI Objects column to Process Explorer to watch GDI object usage across processes:

Also like USER objects, 16-bit interoperability means that USER objects have 16-bit identifiers, limiting them to 65,535 per session. Here’s the desktop as it appeared when Testlimit hit that limit on a Windows Vista 64-bit system:

Note the Start button on the bottom left where it belongs, but the rest of the task bar at the top of the screen. The desktop has turned black and the sidebar has lost most of its color. Your mileage may vary, but you can see that bizarre things start to happen, potentially making it impossible to interact with the desktop in a reliable way. Here’s what the display switched to when I pressed the Start button:

Unlike USER objects, GDI objects aren’t allocated from desktop heaps; instead, on Windows XP and Windows Server 2003 systems that don’t have Terminal Services installed, they allocate from general paged pool; on all other systems they allocate from per-session session pool.
The kernel debugger’s “!vm 4” command dumps general virtual memory information, including session information at the end of the output. On a Windows XP system it shows that session paged pool is unused:

On a Windows Server 2003 system without Terminal Services, the output is similar:

The GDI object memory limit on these systems is therefore the paged pool limit, as described in my previous post, Pushing the Limits of Windows: Paged and Nonpaged Pool. However, when Terminal Services are installed on the same Windows Server 2003 system, you can see from the non-zero session pool usage that GDI objects come from session pool:

The !vm 4 command in the above output also shows the session paged pool maximum and session pool sizes, but the session paged pool maximum and session space sizes don’t display on Windows Vista and higher because they are variable. Session paged pool usage on those systems is capped by either the amount of address space it can grow to or the System Commit Limit, whichever is smaller. Here’s the output of the command on a Windows 7 system showing the current session paged pool usage by session:

As you’d expect, the main interactive session, Session 1, is consuming the most session paged pool.
You can use the Testlimit tool with the “–g 0” switch to see what happens when the storage used for GDI objects is exhausted. The number you specify after the –g is the size of the GDI bitmap objects Testlimit allocates, but a size of 0 has Testlimit simply try and allocate the largest objects possible. Here’s the result on a 32-bit Windows XP system:

On a Windows XP or Windows Server 2003 that doesn’t have Terminal Services installed you can use the Poolmon utility from Windows Driver Kit (WDK) to see the GDI object allocations by their pool tag. The output of Poolmon the while Testlimit was exhausting paged pool on the WIndows XP system looks like this when sorted by bytes allocated (type ‘b’ in the Poolmon display to sort by bytes allocated), by inference indicating that Gh05 is the tag for bitmap objects on Windows Server 2003:

On a Windows Server 2003 system with Terminal Services installed, and on Windows Vista and higher, you have to use Poolmon with the /s switch to specify which session you want to view. Here’s Testlimit executed on a Windows Server 2003 system that has Terminal Services installed:

The command “poolmon /s1” shows the tags with the largest allocation contributing for Session 1. You can see the Gh15 tag at the top, showing that a different pool tag is being used for bitmap allocations:

Note how Testlimit was able to allocate around 58 MB of bitmap data (that number doesn’t account for GDI’s internal overhead for a bitmap object) on the Windows XP system, but only 10MB on the Windows Server 2003 system. The smaller number comes from the fact that session pool on the Windows Server 2003 Terminal Server system is only 32 MB, which is about the amount of memory Poolmon shows attributed to the Gh15 tag. The output of “!vm 4” confirms that session pool for Session1 is been consumed and that subsequent attempts to allocate GDI objects from session pool have failed:

You can also use the !poolused kernel debugger command to look at session pool usage. First, switch to the correct session by using the .process command with the /p switch and the address of a process object that’s connected to the session. To see what processes are running in a particular session, use the !sprocess command. Here’s the output of !poolmon on the same Windows Server 2003 system, where the “c” option to !poolused has it sort the output by allocated bytes:

Unfortunately, there’s no public mapping between the window manager’s heap tags and the objects they represent, but the kernel debugger’s !poolused command uses the triage.ini file from the debugger’s installation directory to print more descriptive information about a tag. The command reports that Gh15 is GDITAG_HMGR_SPRITE_TYPE, which is only slightly more helpful, but others are more clear.
Fortunately, most GDI and USER object issues are limited to a particular process hitting the per-process 10,000 object limit and so more advanced investigation to figure out what process is responsible for exhausting session pool or allocating GDI objects to exhaust paged pool is unnecessary.
Next time I’ll take a look at System Page Table Entries (System PTEs), another key system resource that can has limits that can be hit, especially on Remote Desktop sessions on Windows Server 2003 systems.
Comments
- nathan_worksJanuary 1, 2003
Out of curiosity, why did the pool tag change ? For the OS version change ? Changed to reflect session doing the alloc (also implying OS version, and possible TS dependency) ? Other ?
-
January 1, 2003
"Next time I’ll take a look at System Page Table Entries (System PTEs), another key system resource that can has limits that can be hit, especially on Remote Desktop sessions on Windows Server 2003 systems."
Mark, can also look on problem with "The driver is mismanaging system PTEs" under XP x64 SP2, described here - http://hardforum.com/showthread.php?p=1034479726#post1034479726 ?
-
January 1, 2003
And what about GDIProcessHandleQuota & USERProcessHandleQuota?
-
AnonymousJanuary 1, 2003The comment has been removed
-
AnonymousMarch 31, 2010The comment has been removed
-
Vineel Kumar ReddyApril 1, 2010
Awesome......
what tool do you use to illustrated(decorate) your images...please let us know....
thanks.
-
TheNetAvengerApril 1, 2010
@War59312 @Will
From the Blog, "As it does for USER objects, the window manager limits processes to at most 10,000 GDI objects."
In Part 1 of the blog Mark states, "A basic limitation imposed by the window manager is that no process can create more than 10,000 USER objects."
If you note from the screenshot Mark is using several processes to deplete the pools, so in theory one application won't cause this type of problem.
If you are worried about DOS attacks, if someone is able to run code on your computer, a DOS attack would be the last thing you need to be worried about.
As for CPU Usage hitting 100%, Vista and Win7 do take notice even though it can't just terminate random processes that spike or use 100% of the CPU, as appications and games often do shove the CPU usage to 100% for extended periods of time. This would makes gamers really unhappy.
I'm sure Mark could explain both of these better than I, so I won't go into any further details.
- skip4April 1, 2010
On my old system at my last job, it had a strange behavior. When I had more than a certain amount of apps open - Alt-TAB would no longer bring up the task list, but would instead cycle through the applications without showing anything. I wonder what resource it was running out of? Closing a few apps would sort-of "fix" it.
It was definitely an issue though, because when it would happen, if I did a shutdown/restart more often than not it would take 15-20 minutes to complete, but if I didn't, the system would be terribly unstable until I did.
-
DriverDudeApril 2, 2010
What bugs me about the GDI and USER object limits is that they don't scale with system RAM. If I have an app that is hitting CPU, RAM or disk space limits, I can usually add more of something (or upgrade to 64-bits) to solve the problem.
But USER and GDI handles seem like an artifically low limit that no amount of RAM will help. Most people never hit those limits but when it happens, it really messes things up.
-
Harry JohnstonApril 12, 2010
DriverDude: I think the important point here is that applications may have legitimate reasons for needing more CPU, more RAM, or more disk space - but any application that is running out of USER or GDI handles is faulty.
To the best of my knowledge, at any rate, there is no legitimate reason why an application would need lots of USER and/or GDI handles.
- BrentApril 13, 2010
Mark: Is the 65k address indentifers limit still valid on a 64bit OS? I was under the impression that the 16bit WOW isnt included in a 64bit OS?
-
ncApril 13, 2010
@Brent
The 16-bit subsystem isn't included in x64 Windows, but that doesn't stop use of a 16-bit (2 byte) unsigned short integer in a program.
- Dan_ITApril 15, 2010
@Skip IIRC Windows can be configured to do this, not sure if number of windows open has anything to do with it.
-
AnonymousApril 15, 2010The comment has been removed
-
mpbkApril 20, 2010
Redesign? Why bother? How many times does resource exhaustion ever happen to you?
- CoreyApril 22, 2010
From what I understand this really only affects 16 bits of data. So would running on a 64-bit stop one program from using all the resources? How about a quad core? I'm guessing a program can only take up one core at a time.
-
ncApril 22, 2010
@Corey
There are only 2^16 places at the dinner table, regardless of how big the room is.
A program with multiple threads can spawn a thread per CPU core, and make that thread as busy as it likes.
-
AnonymousJune 7, 2010The comment has been removed
- Rune3June 7, 2010
It has been years since I looked at these limits, but as I recall you can bump up the number of GDI and User handles quite a bit. Further more, I think I even tested allocating a bunch more handles than 2^16 on 64-bit XP, but admittedly my memory is a bit fuzzy at this point. The desktop heap size is noticably larger under 64-bit Windows, so at least there is some relief to be found there.
-
KodiyanJune 8, 2010
Its really a good piece of info. Thanks.
-
AnonymousJune 9, 2010The comment has been removed
-
AnonymousJuly 20, 2010The comment has been removed
-
AnonymousJuly 20, 2010The comment has been removed
- SylkSeptember 3, 2010
Hello, my IE8's GDI objects seem to be leaking... Are there any great tools to check the stacks of leaked GDI objects creation.
- 'Ary'March 30, 2011
dear mark,
please creat blog about The performance Scaling in the Windows Server / Client, and how to measure and check the bottleneck: network, hardware, software.
南来地,北往的,上班的,下岗的,走过路过不要错过!
======================个性签名=====================
之前认为Apple 的iOS 设计的要比 Android 稳定,我错了吗?
下载的许多客户端程序/游戏程序,经常会Crash,是程序写的不好(内存泄漏?刚启动也会吗?)还是iOS本身的不稳定!!!
如果在Android手机中可以简单联接到ddms,就可以查看系统log,很容易看到程序为什么出错,在iPhone中如何得知呢?试试Organizer吧,分析一下Device logs,也许有用.


 浙公网安备 33010602011771号
excellent.