
Viewing the Call Stack in WinDbg
The call stack is the chain of function calls that have led to the current location of the program counter. The top function on the call stack is the current function, the next function is the function that called the current function, and so on. The call stack that is displayed is based on the current program counter, unless you change the register context. For more information about how to change the register context, see Changing Contexts.
In WinDbg, you can view the call stack by entering commands or by using the Calls window.
Debugger Command Window
You can view the call stack by entering one of the k (Display Stack Backtrace) commands in the Debugger Command window.
Calls Window
As an alternative to the k command, you can view the call stack in the Calls window. To open the Calls window, choose Call Stack from the View menu.
The following screen shot shows an example of a Calls window.
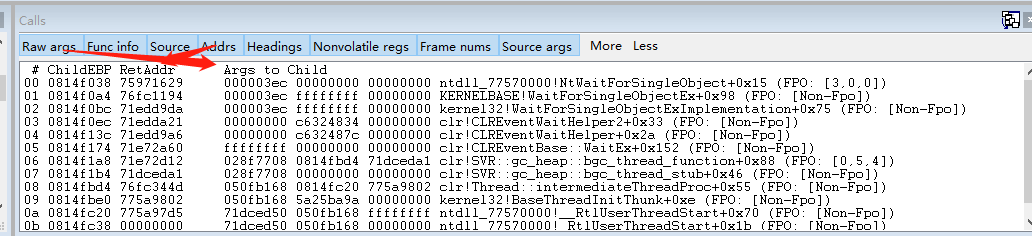
Buttons in the Calls window enable you to customize the view of the call stack. To move to the corresponding call location in the Source window or Disassembly window, double-click a line of the call stack, or select a line and press ENTER. This action also changes the local context to the selected stack frame. For more information about running to or from this point, see Controlling the Target.
In user mode, the stack trace is based on the stack of the current thread. For more information about the stack of the current thread, see Controlling Processes and Threads.
In kernel mode, the stack trace is based on the current register context. You can set the register context to match a specific thread, context record, or trap frame. For more information about setting the register context, see Register Context.
The Calls window has a toolbar that contains several buttons and has a shortcut menu with additional commands. To access this menu, select and hold (or right-click) the title bar or select the icon near the upper-right corner of the window ( ). The toolbar and menu contain the following buttons and commands:
-
Raw args displays the first three parameters that are passed to the function. On an x86-based processor, this display includes the first three parameters that are passed to the function ("Args to Child").
-
Func info displays Frame Pointer Omission (FPO) data and other internal information about the function. This command is available only on an x86-based processor.
-
Source displays source module names and line numbers after the function names (if the debugger has this information).
-
Addrs displays various frame-related addresses. On an x86-based processor, this display includes the base pointer for the stack frame ("ChildEBP") and the return address ("RetAddr").
-
Frame nums displays frame numbers. Frames are always numbered consecutively, beginning with zero.
-
Arg types displays detailed information about the arguments that are expected and received by the functions in the stack.
-
Always floating causes the window to remain undocked even if it is dragged to a docking location.
-
Move with frame causes the window to move when the WinDbg frame is moved, even if the window is undocked. For more information about docked, tabbed, and floating windows, see Positioning the Windows.
『22.5帧指针省略』
我们在224节介绍了栈帧的概念和用于标志栈帧位置的帧指针。帧指针不仅对函数中的代 码起到定位变量和参数的参照物作用’还将栈中的_个个栈帧串联在_起,形成—个可以遍历 所有栈帧的链条。但是并不是所有函数都会建立帧指针’某些优化过的函数省去了建立和维护 帧指针所需的指令’这些函数所对应的栈帧就不再有帧指针,这种情况称为帧指针省略(Frame PojnterOmissjon’ FPO)°
清单22ˉ9所示的FuncB函数便使用了FPO’从其反汇编代码中我们找不到建立和恢复帧指针的指令°(EBP)从理论上讲’使用FPO可以省略一些指令’减小目标文件’提高运行速度’因此 FPO成为速度优化和空间优化的_种方法°VC6编译器在编译发布版本时默认会开启FPO选项°
在使用FPO的函数中’因为没有固定位置的帧指针可以参考’所以必须使用其他参照物来 引用局部变量’如我们前面所讨论的’在x86系统中’通常使用ESP寄存器°因为ESP寄存器 的值是经常变化的’所以对同—个局部变量的引用所需的偏移量也是变化的’这给跟踪这样的代码增加了难度。使用FPO的另一个副作用就是对于采用FPO优化的函数’因为没有了帧指针’所以给生成栈回溯信息带来了不便。
当执行使用FPO优化过的函数时’EBP寄存器指向的仍然是前—个栈帧°这使得我们很难为 这样的函数产生帧信息°为了解决这一问题’编译器在生成调试符号时’会为使用FPO的函数产生FPO信息°利用调试符号中的FPO信息,调试器可以为省略帧指针的函数生成回溯信息°
我们先来做个实验在WinDBG中加载发布版本的LocalVar程序’用bpLocalVar!FuncB+0x7 设置—个断点’然后执行到这个位置。发出kv命令看WinDBG产生的栈回溯信息。
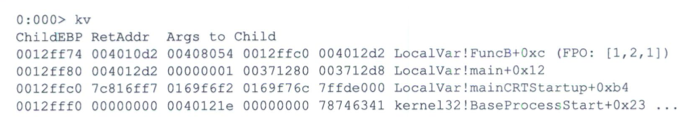
我们看到’WinDBG产生了非常好的栈回溯信息’也为经过FPO优化的FuncB函数产生了 完整的帧信息。观察此时的EBP和ESP寄存器°
0;000>reDp′ esp ehp=0012ff80esp=0012ff70
可以看到EBP寄存器指向的仍然是main函数的栈帧°那么WinDBG是如何生成FuncB函数的栈帧信息的呢?
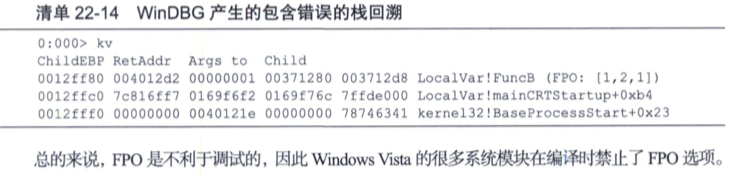
答案是依靠调试符号中的附加信息°我们先来看_下FuncB函数那—行的 末尾方括号中的信息(FPO:[l’2’l])代表的含义。
FPO代表对应的函数采用了FPO优化’方括号中的3个数字中
1 表示FuncB函数有一个参数;
2 表示为局部变量分配的栈空间是2个DWORD长(即8字节);
1 表示使用栈保存的寄存器个数为l’即有—个寄存器(第5行压人的 EDI)被压人栈中并保存。
以上信息来源于符号文件中的帧数据(FrameData)表’下面我们介绍一下WinDBG是如何利用这些信息来产生FuncB的栈帧记录的。
仍然根据EIP寄存器的值寻找最靠近的函数符号’ 也就是找到FuncB。在FuncB的符号信息中有_个字段是这个函数的RVA,也就是这个函数的 人口相对于模块起始地址的偏移量’其值为0xl040°根据FuncB的RVA’WmDBG可以在符号文件中搜索到这个函数的FPO信息’在符号文件中FPO信息是按照它所描述函数的RVA来 组织的°根据FPO信息,WinDBG可以知道函数的参数长度(0x4)、局部变量的长度(0x8)、 代码块的长度(0x62)等信息.根据这些信息和当前的程序指针位置以及栈指针值’结合反汇 编,调试器可以推算出当前函数的帧指针值°比如对于我们目前分析的执行点’CPU执行到 FuncB的偏移7字节处’根据反汇编分析WinDBG可以知道已经执行了局部变量分配操作,因 此ESP寄存器的值加上局部变量的长度便是当前栈帧的边界’即ESP+8=00]2H78。根据惯例’ 帧指针指向的应该是当前栈帧的第—个DWORD’因此应该把这个值减去4’即0x00l2fI74是 当前函数的帧指针(ChildEBP)。得到帧指针后’便可以像处理普通帧那样显示参数利返回值了°
为了证明调试符号对产生栈回溯信息的重要性,停止调试并将LocalVarPDB文件改名为 LocalVarBAK’然后再重复以上过程(可以直接使用地址来设置断点bp0040l04b)。
这时kv命 令显示的信息如下°
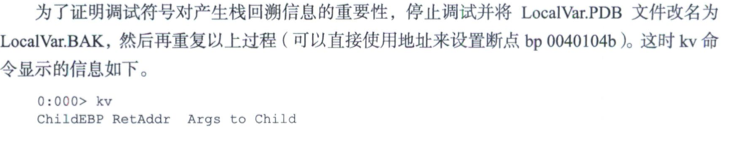
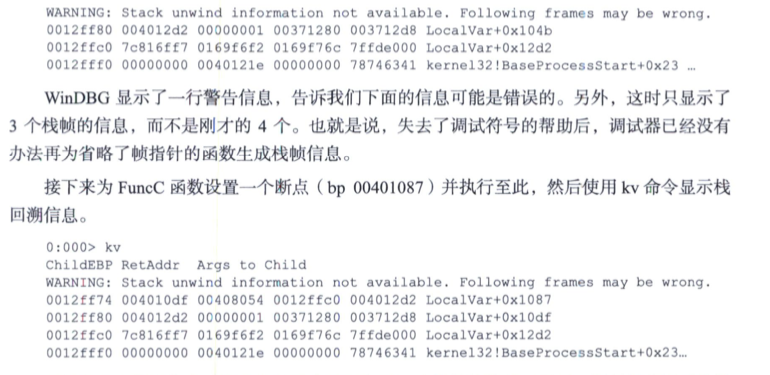
尽管仍然有警告信息’但是此时正确显示出了4个栈帧的情况°可见,同样没有调试符号 的情况下,对于采用FPO的FuncB函数’调试器无法显示出它的帧信息;而对于未采用FPO 的FunCC函数°调试器仍然可以显示出帧信息。也就是说’没有采用FPO优化的函数具有更好 的可调试性’因此’编译器在编译调试版本时通常会禁止包括FPO在内的所有优化选项°
最后要说明的是’处理FPO对于调试器来说是—件比较复杂的操作’有时也可能出现错误° 例如’如果当前位置在FuncB的人口处’那么WinDBG会将FuncB函数显示到main函数所在 的栈帧,产生的包含错误的栈回溯如清单22ˉl4所示°
windbg k command
If you use the kb or kv commands, the first three parameters that are passed to each function are displayed.
If you use the kv command, FPO data is also displayed.
On an x86-based processor, the kv command also displays calling convention information.
When you use the kv command, the FPO information is added at the end of the line in the following format.
| FPO text | Meaning |
|---|---|
| FPO: [non-Fpo] | No FPO data for the frame. |
| FPO: [N1,N2,N3] | N1 is the total number of parameters.
N2 is the number of DWORD values for the local variables. N3 is the number of registers that are saved. |
| FPO: [N1,N2] TrapFrame @ Address | N1 is the total number of parameters.
N2 is the number of DWORD values for the locals. Address is the address of the trap frame. |
| FPO: TaskGate Segment:0 | Segment is the segment selector for the task gate. |
| FPO: [EBP 0xBase] | Base is the base pointer for the frame. |
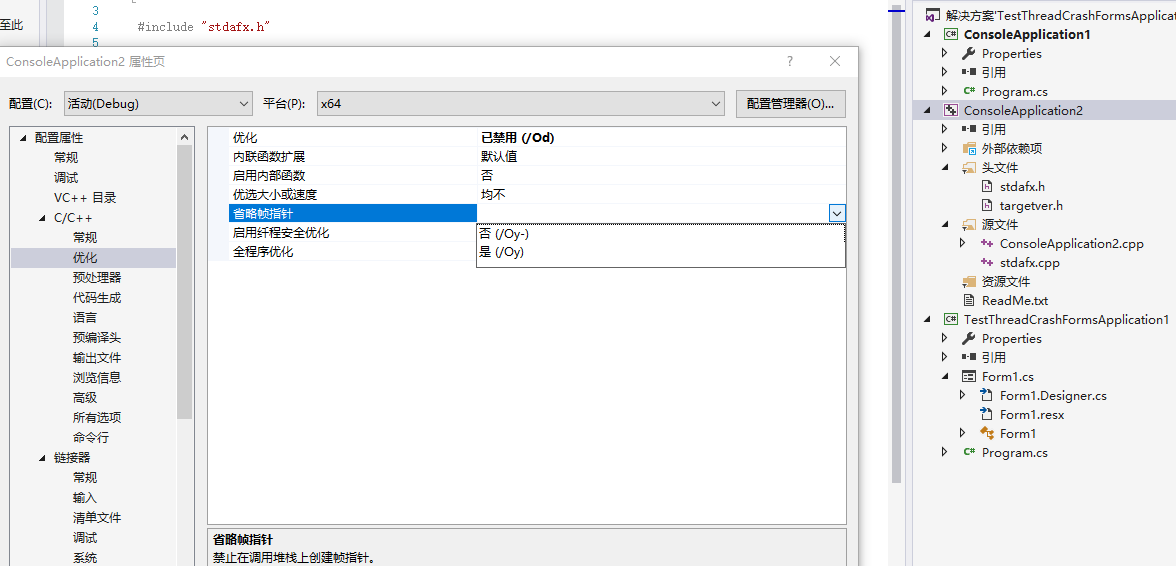
/Oy(框架指针省略)
此选项可以加快函数调用的速度,因为无需设置和移除任何框架指针。 它还将释放一个寄存器以用于常规用途。
/Oy 启用帧指针省略,/Oy- 禁用省略。 在 x64 编译器中,/Oy 和 /Oy- 不可用。
如果你的代码需要基于帧的寻址,你可以在 /Ox 选项之后指定 /Oy- 选项,或者使用带有“y”和 off 参数的 optimize,从而通过基于帧的寻址获得最大优化。 编译器可检测大部分需要基于帧的寻址的情况(例如,使用 _alloca 和 setjmp 函数以及使用结构化异常处理的情况)。
/Ox(启用大多数速度优化)和 /O1、/O2(最大程度减小大小,提高速度)选项意味着使用 /Oy。
在 /Ox 、/O1 或 /O2 选项之后指定 /Oy- 会禁用 /Oy,无论 /Oy 是显式的还是隐含的。
/Oy 编译器选项使得调试器更加难以使用,这是因为编译器取消显示帧指针信息。
如果指定 debug 编译器选项(/Z7、/Zi、/ZI),则建议你在任何其他优化编译器选项后指定 /Oy- 选项。
南来地,北往的,上班的,下岗的,走过路过不要错过!
======================个性签名=====================
之前认为Apple 的iOS 设计的要比 Android 稳定,我错了吗?
下载的许多客户端程序/游戏程序,经常会Crash,是程序写的不好(内存泄漏?刚启动也会吗?)还是iOS本身的不稳定!!!
如果在Android手机中可以简单联接到ddms,就可以查看系统log,很容易看到程序为什么出错,在iPhone中如何得知呢?试试Organizer吧,分析一下Device logs,也许有用.


 浙公网安备 33010602011771号