ECharts多图共享一个dataset
<!DOCTYPE html>
<html lang="en">
<head>
    <meta charset="UTF-8">
    <title>多图表共享一个dataset,并带有联动交互</title>
    <!--引入Echarts文件-->
    <script src="js/echarts.min.js"></script>
</head>
<body>
<div id="main" style="width: 800px;height:400px;"></div>
<script type="text/javascript">
    var dom=document.getElementById("main");
    var myChart=echarts.init(dom);
    var app={};
    var option=null;


    setTimeout(function () {
        option = {
            legend: {},
            tooltip: {
                trigger: 'axis',//触发类型,'axis'为坐标系触发
                showContent: false//是否显示提示框浮层
            },
            dataset: {
                source: [
                    ['product', '2012', '2013', '2014', '2015', '2016', '2017'],
                    ['Matcha Latte', 41.1, 30.4, 65.1, 53.3, 83.8, 98.7],
                    ['Milk Tea', 86.5, 92.1, 85.7, 83.1, 73.4, 55.1],
                    ['Cheese Cocoa', 24.1, 67.2, 79.5, 86.4, 65.2, 82.5],
                    ['Walnut Brownie', 55.2, 67.1, 69.2, 72.4, 53.9, 39.1]
                ]
            },
            xAxis: {type: 'category'},
            yAxis: {gridIndex: 0},//y轴所在的grid的索引
            grid: {top: '55%'},
            series: [
                //smooth:是否平滑曲线显示,若是boolean属性,表示开启平滑处理,若是number类型(取直范围0到1)
                //则表示平滑程度,越小表示越接近折线段
                //seriesLayoutBy:'row'表示dataset中每一行是一个维度(dimension)
                {type: 'line', smooth: true, seriesLayoutBy: 'row'},
                {type: 'line', smooth: true, seriesLayoutBy: 'row'},
                {type: 'line', smooth: true, seriesLayoutBy: 'row'},
                {type: 'line', smooth: true, seriesLayoutBy: 'row'},
                {
                    type: 'pie',
                    id: 'pie',  //组件ID
                    radius: '30%',  //饼图的半径
                    //center:饼圆的中心(圆心)坐标,第一项是横坐标,第二项是纵坐标
                    //设置成百分比时第一项是相对于容器宽度,第二项是相对于容器高度。
                    center: ['50%', '25%'],
                    label: {
                        formatter: '{b}: {@2012} ({d}%)'
                    },
                    encode: {
                        itemName: 'product',
                        value: '2012',
                        tooltip: '2012'
                    }
                }
            ]
        };

        myChart.on('updateAxisPointer', function (event) {
            var xAxisInfo = event.axesInfo[0];
            if (xAxisInfo) {
                var dimension = xAxisInfo.value + 1;
                myChart.setOption({
                    series: {
                        id: 'pie',
                        label: {
                            formatter: '{b}: {@[' + dimension + ']} ({d}%)'
                        },
                        encode: {
                            value: dimension,
                            tooltip: dimension    //表示维度在tooltip(提示框组件)中显示
                        }
                    }
                });
            }
        });

        myChart.setOption(option);
    });
   /* if (option && typeof option === "object") {
        myChart.setOption(option, true);
    }*/
</script>
</body>
</html>
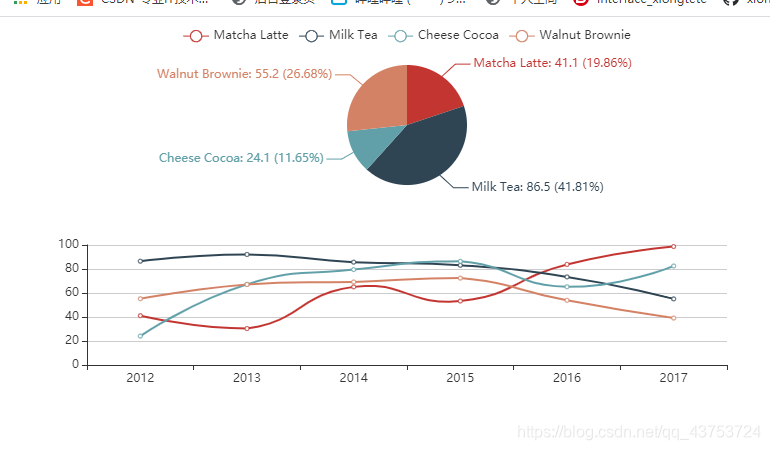
![在这里插入图片描述]()

 浙公网安备 33010602011771号