第7章 图形处理与操作
7.1 图形标注
7.1.1 坐标轴与图形标注
xlabel(txt) % 为当前坐标区或图的x轴添加标签或替换旧标签
xlabel(target,txt) % 为指定的目标对象添加标签
xlabel(___,Name,Value) % 使用一个或多个名称—值参数对修改标签外观
| 控制字符串 |
转换字符串 |
控制字符串 |
转换字符串 |
控制字符串 |
转换字符串 |
| \alpha |
\(\alpha\) |
\eta |
\(\eta\) |
\pi |
\(\pi\) |
| \beta |
\(\beta\) |
\theta |
\(\theta\) |
\omega |
\(\omega\) |
| \gamma |
\(\gamma\) |
\leftarrow |
\(\leftarrow\) |
\tau |
\(\tau\) |
| \delta |
\(\delta\) |
\lambda |
\(\lambda\) |
\sigma |
\(\sigma\) |
| \epsilon |
\(\epsilon\) |
\mu |
\(\mu\) |
\kappa |
\(\kappa\) |
| \zeta |
\(\zeta\) |
\xi |
\(\xi\) |
\uparrow |
\(\uparrow\) |
| 控制字符串 |
含义 |
控制字符串 |
含义 |
| ^{} |
上标 |
\rm |
标准形式 |
| _{} |
下标 |
\fontname |
定义字体 |
| bf |
粗体 |
\fontsize{specifier) |
定义字体大小 |
| \it |
斜体 |
\color{specifier) |
定义字体颜色 |
| \sl |
透视 |
\color[rgb] |
自定义字体颜色 |
>> x=0:0.1*pi:3*pi;
y=2*cos(x);
plot(x,y)
xlabel({'x','0 \leq x \leq 2\pi'}); % x轴添加两行标签
ylabel('y');
title('y=2cos(x)','fontsize',12,'fontweight','bold','fontname','仿宋')
![7.1.1 坐标轴和图形标注]()
>> clf
>> subplot(1,2,1), plot((1:10).^2)
>> year=2014;
>> xlabel(['Population for Year ',num2str(year)]) % 标签中包含变量值year
>> t=linspace(0,1);
>> y=exp(t);
>> subplot(1,2,2), plot(t,y)
>> xlabel('t_{seconds}') % 标签中包含下标
>> ylabel('e^t','FontSize',12,'FontWeight','bold','Color','r')
![7.1.1 坐标轴标注]()
7.1.2 图形的文本标注
text(x,y,txt) % 使用由txt指定的文本,向当前坐标区中的一个或多个数据点添加文本
text(x,y,z,txt) % 在三维坐标中定位文本
text(___,Name,Value) % 使用一个或多个名称—值参数对指定txt对象的属性

gtext(str) % 使用鼠标在所需位置单击或按任意键(Enter除外)插入文本str
gtext(str,Name,Value) % 使用一个或多个名称—值参数对指定文本属性
>> clf
>> x=0:0.1*pi:3*pi;
>> y=2*cos(x);
>> subplot(1,2,1), plot(x,y)
>> text(pi/2,2*cos(pi/2),'\leftarrow 2cos(x)=0','FontSize',10)
>> text(5*pi/4,2*cos(5*pi/4),'\rightarrow 2cos(x)=-1.414','FontSize',10)
>> subplot(1,2,2), plot(x,y)
>> gtext('y=2cos(x)','fontsize',10)
![7.1.2 图形的文本标注]()
7.1.3 图例的标注
legend % 为每个绘制的数据序列创建一个带有描述性标签的图例
legend(label1,...,labelN) % 设置图例标签,以字符向量或字符串列表形式指定标签
legend(labels) % 使用字符向量元胞数组、字符串数组或字符矩阵设置标签
legend(subset,___) % 在图例中仅包括subset(图形对象向量)列出的数据序列的项
legend(target,___) % 使用target指定的坐标区作图
legend(___,Location,lcn) % 设置图例位置
legend(___,'Orientation',ornt) % ornt为horizontal时并排显示,默认垂直显示
legend(___,Name,Value) % 使用一个或多个名称—值参数对设置图例属性
| 字符串 |
位置 |
字符串 |
位置 |
| North |
绘图区内的上中部 |
South |
绘图区内的底部 |
| East |
绘图区内的右部 |
West |
绘图区内的左中部 |
| NorthEast |
绘图区内的右上部 |
NorthWest |
绘图区内的左上部 |
| SouthEast |
绘图区内的右下部 |
SouthWest |
绘图区内的左下部 |
| NorthOutside |
绘图区外的上中部 |
SouthOutside |
绘图区外的下部 |
| EastOutside |
绘图区外的右部 |
WestOutside |
绘图区外的左部 |
| NorthEastOutside |
绘图区外的右上部 |
North WestOutside |
绘图区外的左上部 |
| SouthEastOutside |
绘图区外的右下部 |
South WestOutside |
绘图区外的左下部 |
| Best |
标注与图形的重叠最小处 |
BestOutside |
绘图区外占用最小面积处 |
>> clf
>> x=linspace(0,pi);
>> y1=cos(x);
>> y2=cos(2*x);
>> y3=cos(3*x);
>> plot(x,y1, x,y2, x,y3)
>> legend({'cos(x)','cos(2x)','cos(3x)'},'Location','northwest','NumColumns',2)
![7.1.3 图例标注]()
7.2 图形控制
7.2.1 图形数据取点
[x,y]=ginput(n) % 通过鼠标选择n个点,其坐标值保存在[x,y]中,按Enter键结束取点
[x,y]=ginput % 取点数目不受限制,其坐标值保存在[x,y]中,按Enter键结束取点
[x,y,button]=ginput(...) % 返回值button记录有选取每个点时的相关信息
>> clf
>> x=0:0.05*pi:2*pi;
>> y=2*cos(x).*sin(x);
>> plot(x,y)
>> [m n]=ginput(2)

m =

    1.4761
    4.7891


n =

    0.2360
   -0.1472

>> hold on
>> plot(m,n,'or')
>> text(m(1),n(1),['(',num2str(m(1)),num2str(n(1)),')'])
![7.2.1 ginput命令的执行结果]()
7.2.2 坐标轴控制
7.2.2.1 坐标轴特征控制函数axis
axis(limits) % 指定当前坐标区的范围,包含指定4、6或8个元素的向量形式
axis style % 使用预定义样式设置坐标范围和尺度
axis mode % 设置是否自动选择范围。mode为manual、auto或半自动选项之一
axis ydirection % 当ydirection为ij时,将原点放在坐标区的左上角,y值按从上到下的顺序逐渐增加;取默认值xy时,将原点放在左下角,y按从下到上的顺序逐渐增加
axis visibility % visibility取off/on时,关闭/打开坐标区背景的显示,绘图区仍会显示
lim=axis % 返回当前坐标区的x轴和y轴的范围;对三维坐标区,还会返回z坐标的范围;对极坐标区,返回theta角和r坐标的范围
| 参数 |
字符串 |
说明 |
| limits |
— |
[xmin xmax ymin ymax zmin zmax cmin cmax]:将x坐标范围设置为xmin~xmax;将y坐标范围设置为ymin~ymax;将z坐标范围设置为zmin~zmax;设置颜色范围:cmin对应颜色图中的第一种颜色的数据值;cmax对应颜色图中的最后一种颜色的数据值 |
| mode |
auto |
自动模式,使得坐标范围能容纳下所有的图形 |
| manual |
以当前的坐标范围限定图形的绘制,此后再次使用hold on命令绘图时,保持坐标范围不变 |
| style |
tight |
将坐标范围限制在指定的数据范围内 |
| equal |
将各坐标轴的刻度设置成相同 |
| image |
每个坐标区使用相同的数据单位长度,并使坐标区框线紧密围绕数据 |
| square |
使用相同长度的坐标轴线,相应调整数据单位之间的增量 |
| fill |
设置坐标范围和PlotBoxAspectRatio属性以使坐标满足要求 |
| vis3d |
使图形在旋转或拉伸过程中保持坐标轴的比例不变 |
| normal |
解除对坐标轴的任何限制 |
| visibility |
on |
默认值,恢复对坐标轴的一切设置 |
| off |
取消对坐标轴的一切设置 |
| ydirection |
xy |
默认方向。将坐标设置成直角坐标系 |
| ij |
将坐标设置成矩阵形式,原点在左上角 |
>> clf
>> x=0:0.2:6;
>> subplot(1,2,1), plot(x,exp(x),'-bo') % 系统自动分配坐标轴
>> subplot(1,2,2), plot(x,exp(x),'-bo')
>> axis([0 4 0 80]) % 设定坐标轴后绘制图形
![7.2.2.1 设定坐标轴]()
7.2.2.2 坐标轴网格控制函数grid
grid on % 给当前坐标轴添加网格线
grid off % 取消当前坐标轴的网格线
grid % 在grid on命令和grid off命令之间切换
grid minor % 设置网格线间的间距
>> x=0:0.1*pi:3*pi;
>> y=2*cos(x);
>> plot(x,y)
>> grid on % 添加网格线
>> grid off % 删除网格线
![7.2.2.2 添加网格线]()
![7.2.2.2 删除网格线]()
7.2.2.3 坐标轴封闭控制函数box
box on % 在坐标区周围显示框轮廓
box off % 去除坐标区周围的框轮廓
box % 切换框轮廓的显示
>> x=0:0.1*pi:3*pi;
>> y=2*cos(x);
>> plot(x,y)
>> box off % 将封闭的坐标轴打开
>> box on % 将当前打开的坐标轴重新封闭
![7.2.2.3 将封闭的坐标轴打开]()
![7.2.2.3 重新封闭坐标轴]()
7.2.2.4 坐标轴缩放控制函数zoom
zoom '控制字符串'
| 字符串 |
说明 |
字符串 |
说明 |
| 空 |
在zoom on和zoom off之间切换 |
reset |
设置当前的坐标轴为最初值 |
| on |
允许对坐标轴进行缩放 |
xon |
允许对x轴进行缩放 |
| off |
禁止对坐标轴进行缩放 |
yon |
允许对y轴进行缩放 |
| out |
恢复到最初的坐标轴设置 |
(factor) |
以factor作为缩放因子进行坐标轴的缩放 |
7.2.3 视角与透视控制
7.2.3.1 视角控制命令view
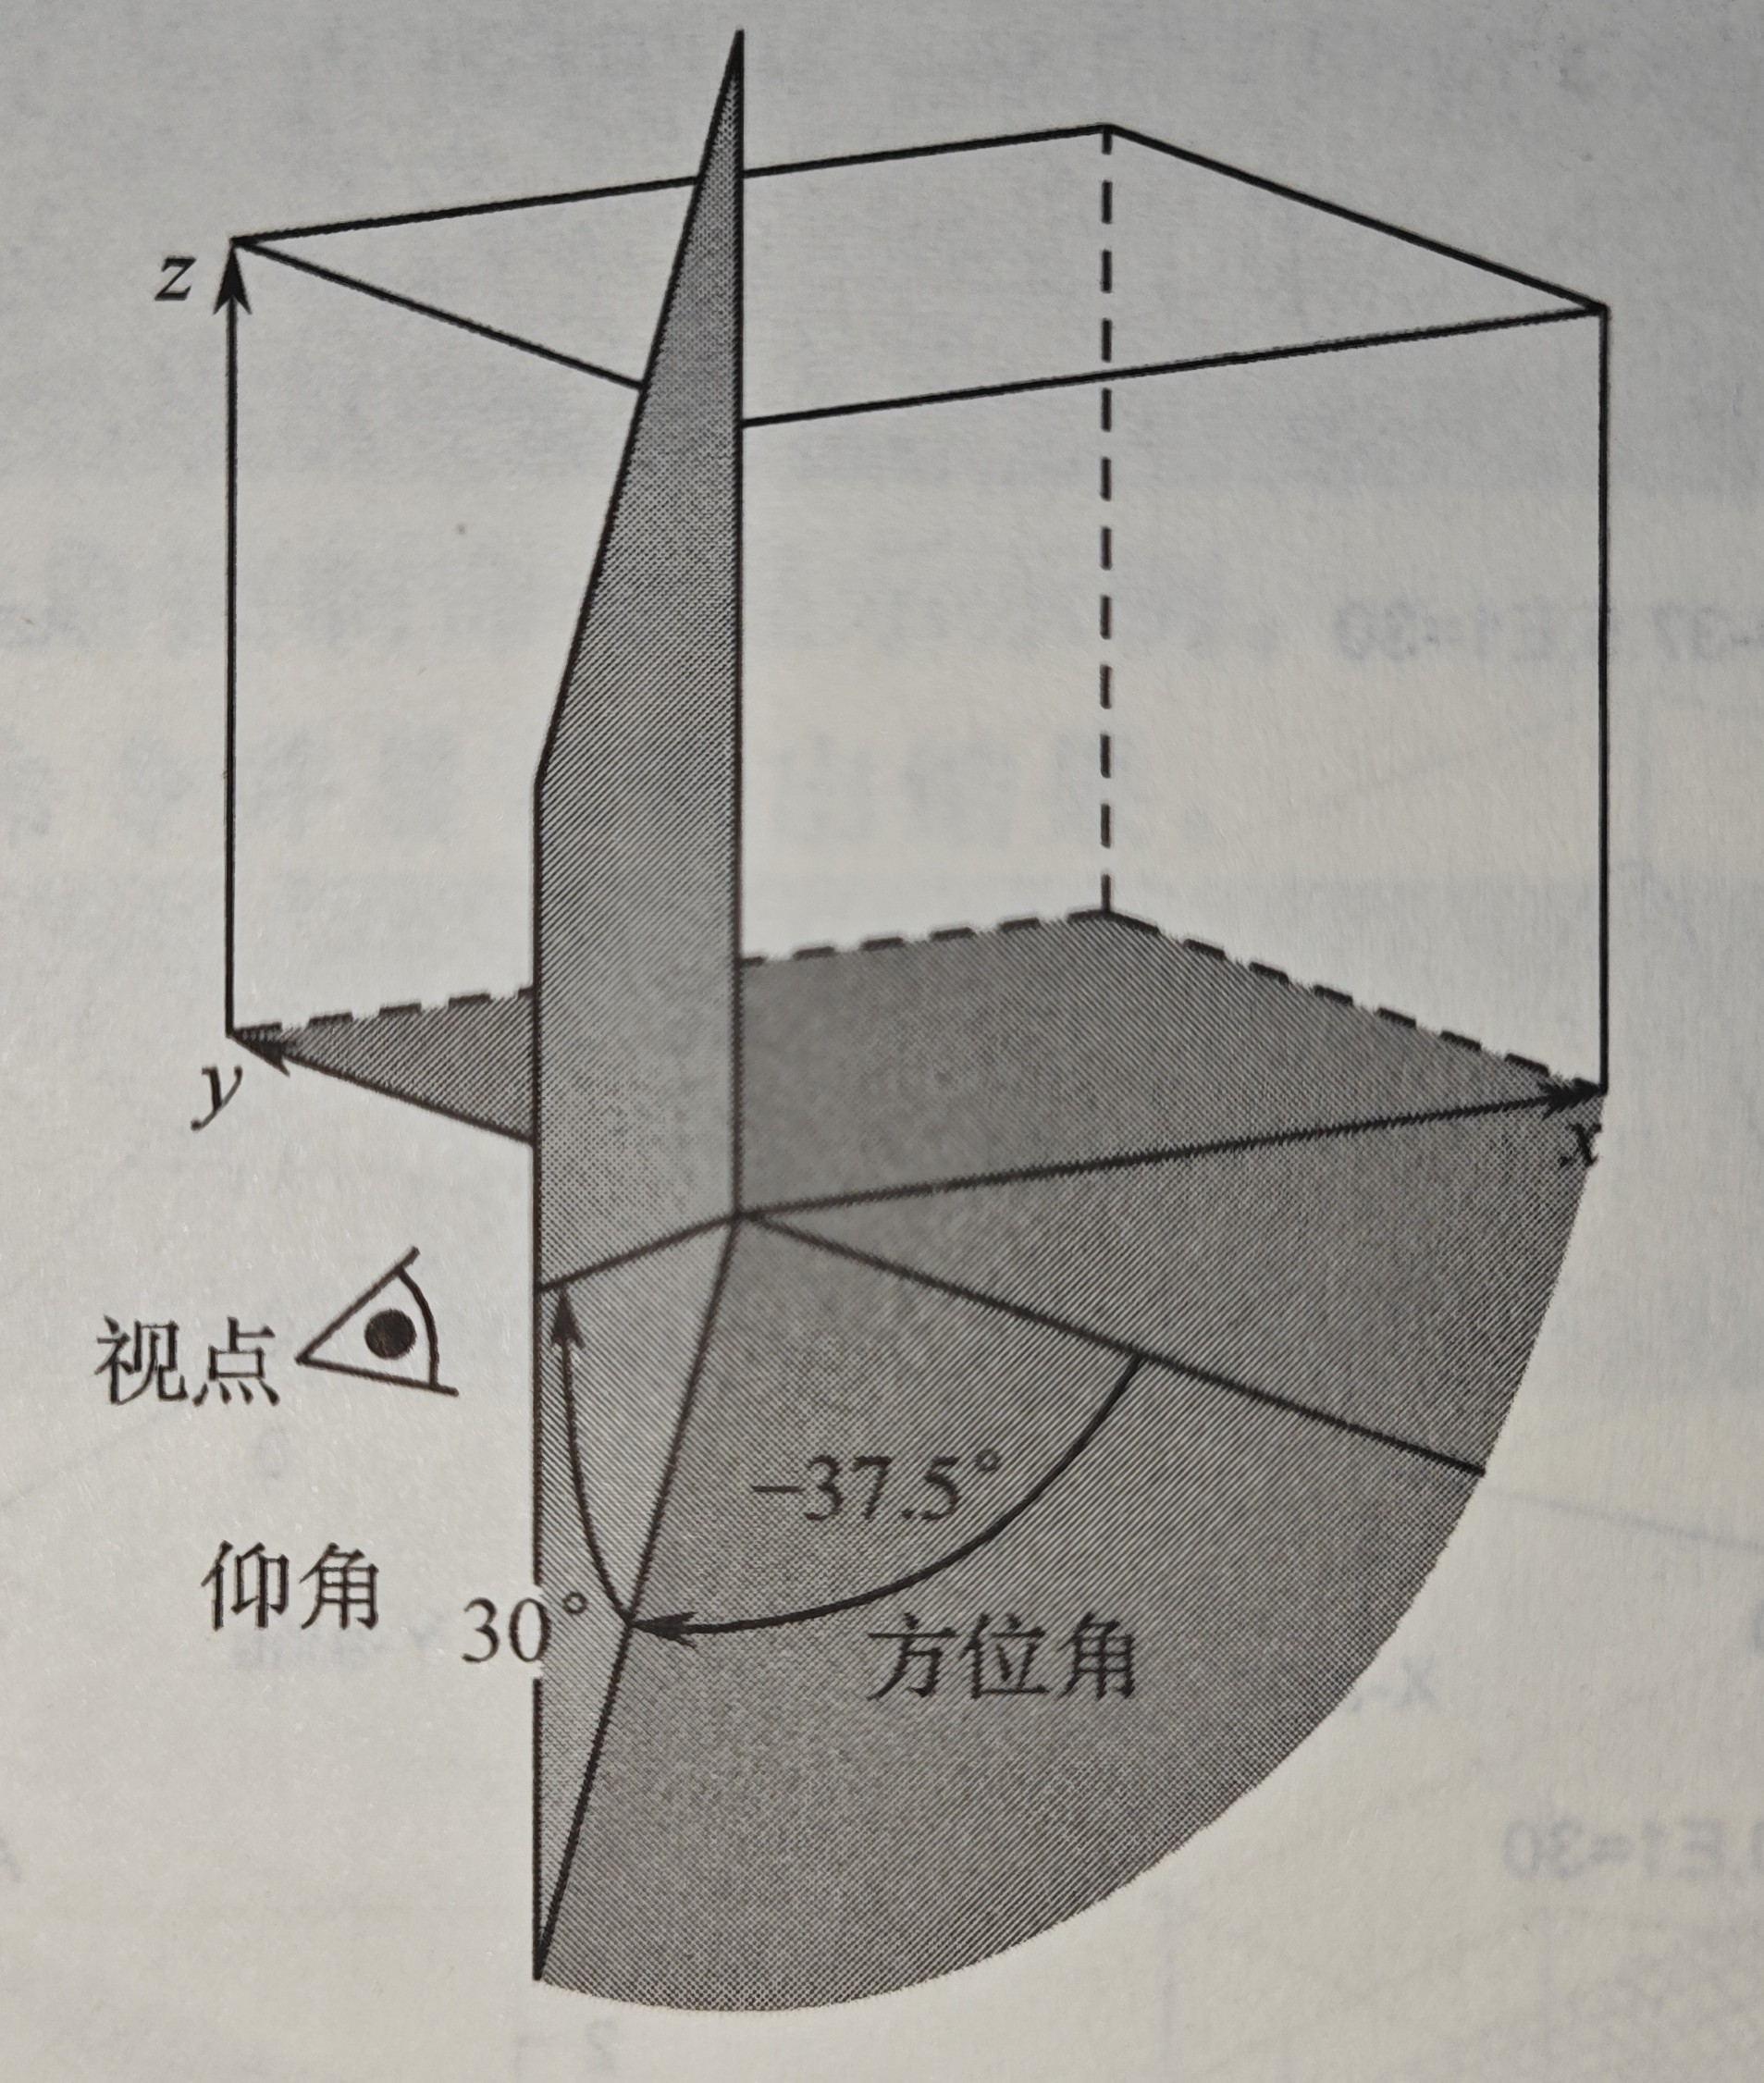
view(az,el) % 为三维空间图形设置观察点的方位角。az为方位角,el为仰角
view([x,y,z]) % 在笛卡儿坐标系中将视角设为沿向量[x,y,z]指向原点
view(2) % 设置默认的二维形式视点。其中,az=0,e1=90,即从z轴上方观看所绘图形
view(3) % 设置默认的三维形式视点。其中,az=-37.5,e1=30
view(T) % 根据转换矩阵T设置视点。其中T为4*4的矩阵
[az,el]=view % 返回当前的方位角az与仰角el
![7.2.3.1 仰角和方位角示意图]()
>> clf
>> X=0:0.1*pi:3*pi; Y=zeros(size(X)); Z=2*cos(X);
>> subplot(2,2,1)
>> plot3(X,Y,Z,'r'); grid;
>> xlabel('X-axis'); ylabel('Y-axis'); zlabel('Z-axis');
>> title('Default Az=-37.5,E1=30');
>> view(-37.5,30);
>> subplot(2,2,2)
>> plot3(X,Y,Z,'r'); grid;
>> xlabel('X-axis'); ylabel('Y-axis'); zlabel('Z-axis');
>> title('Az=-37.5,E1=60');
>> view(-37.5,60);
>> subplot(2,2,3)
>> plot3(X,Y,Z,'b'); grid;
>> xlabel('X-axis'); ylabel('Y-axis'); zlabel('Z-axis');
>> title('Az=60,E1=30');
>> view(60,30);
>> subplot(2,2,4)
>> plot3(X,Y,Z,'b'); grid;
>> xlabel('X-axis'); ylabel('Y-axis'); zlabel('Z-axis');
>> title('Az=90,E1=10');
>> view(90,10);
![7.2.3.1 设置视点]()
7.2.3.2 视角控制命令viewmtx
T=viewmtx(az,el) % 返回一个与视点的方位角az与仰角el对应的正交矩阵,不改变当前视点
T=viewmtx(az,el,phi) % 返回一个透视转换矩阵,参量phi是透视角
T=viewmtx(az,el,phi,xc) % 返回以在标准化的图形立方体中的点xc为目标点的透视矩阵
| phi的值 |
说明 |
| 0° |
正交投影 |
| 10° |
类似于远距离投影 |
| 25° |
类似于普通投影 |
| 60° |
类似于广角投影 |
7.2.3.3 视角控制命令rotate3d
rotate3d on % 打开旋转模式并允许在当前图窗中的所有坐标区上使用旋转
rotate3d off % 关闭旋转模式并禁止在当前图窗中进行交互式坐标区旋转
rotate3d % 在当前图窗中切换交互坐标区旋转
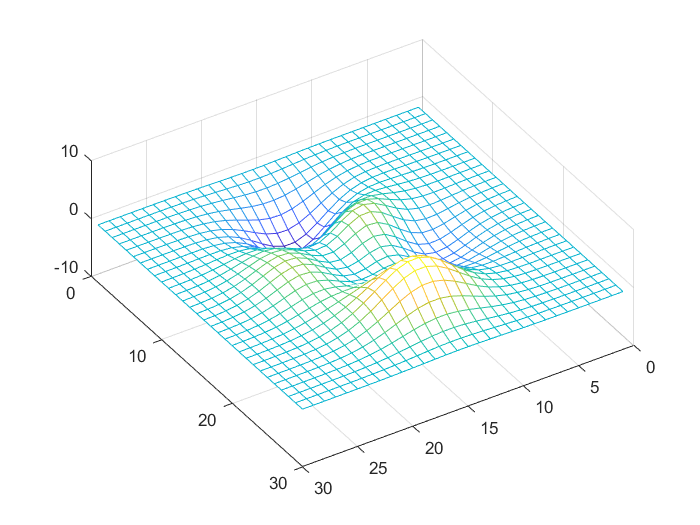
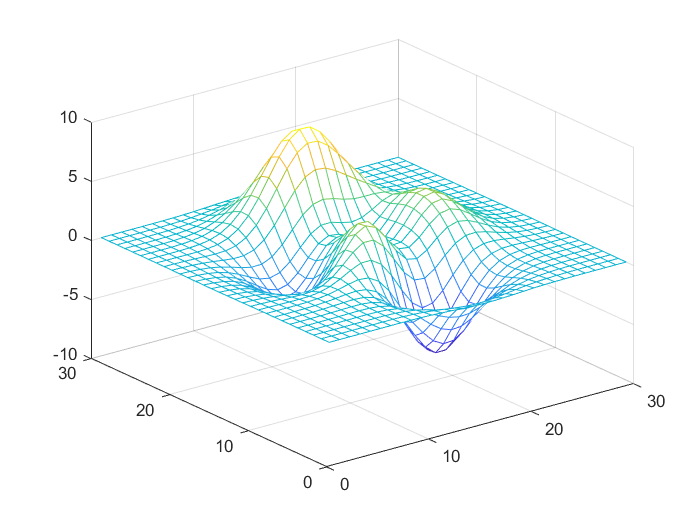
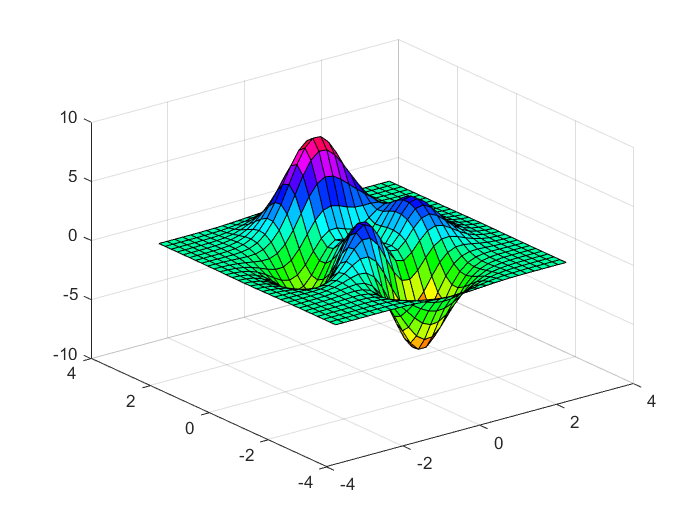
>> a=peaks(30);
>> mesh(a); % 默认的视角显示
>> rotate3d on % 按住鼠标左键,调节视角
![7.2.3.3 默认的视角显示]()
![7.2.3.3 采用rotate3d命令调节视角]()
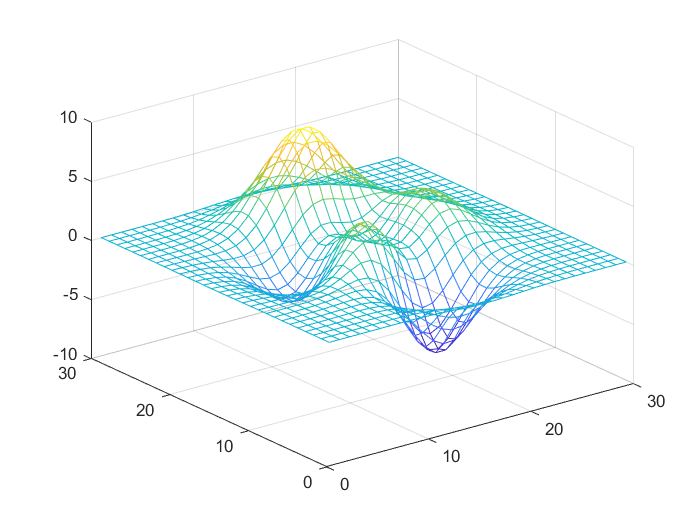
7.2.3.4 三维透视命令hidden
hidden on % 默认状态,对当前网格图启用隐线消除模式,网格后的线会被前面的线遮住
hidden off % 对当前网格图禁用隐线消除模式
hidden % 切换隐线消除状态

alpha(v) % 其中v为透明度参数,取值为0≤v≤1,为0时完全透明,为1时不透明
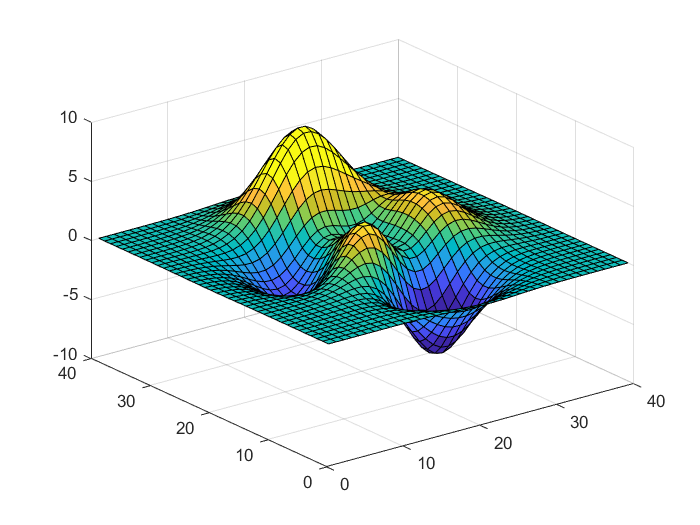
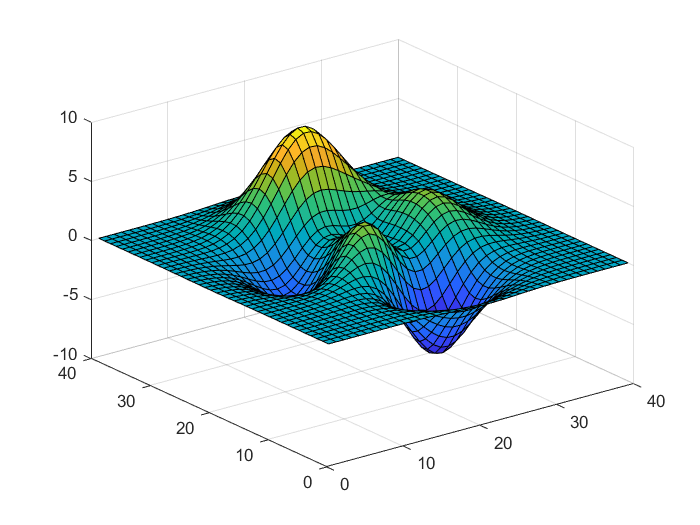
>> a=peaks(30);
>> mesh(a);
>> hidden on
>> hidden off % 打开三维透视功能
![7.2.3.4 关闭三维透视功能]()
![7.2.3.4 打开三维透视功能]()
7.2.4 图形色彩控制
| 原色 |
调得的颜色 |
| 红(R) |
绿(G) |
蓝(B) |
| 1 |
0 |
0 |
红色 |
| 1 |
0 |
1 |
洋红色 |
| 1 |
1 |
0 |
黄色 |
| 0 |
1 |
0 |
绿色 |
| 0 |
1 |
1 |
青色 |
| 0 |
0 |
1 |
蓝色 |
| 0 |
0 |
0 |
黑色 |
| 1 |
1 |
1 |
白色 |
| 0.5 |
0.5 |
0.5 |
灰色 |
colormap([R,G,B]) % 输入变量[R,G,B]为一个3列矩阵,行数不限,该矩阵称为色图
| 色图名称 |
生成函数 |
色图名称 |
生成函数 |
| 默认色图 |
default |
黑红黄白色图 |
hot |
| 红黄色图 |
autumn |
饱和色图 |
hsv |
| 蓝色调灰度色图 |
bone |
粉红色图 |
pink |
| 青红浓淡色图 |
cool |
光谱色图 |
prism |
| 线性灰度色图 |
gray |
线性色图 |
lines |
>> [x,y,z]=peaks(30);
>> surf(x,y,z);
>> colormap(hsv(128)) % 定义图形为饱和色图,定义了128种颜色
![7.2.4 色彩控制绘图]()
7.2.4.1 shading命令
shading flat % 平滑方式着色
shading faceted % 以平面为着色单位,这是系统默认的着色方式
shading interp % 以插值形式为图形的像点着色
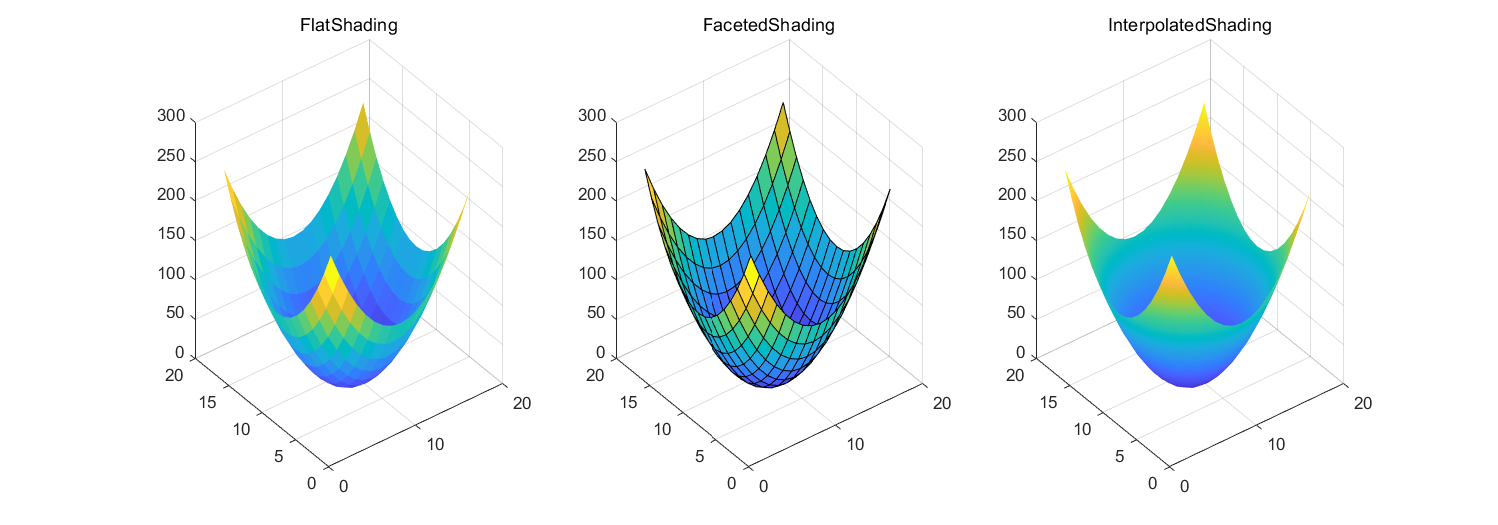
>> x=-8:8; y=x;
>> [X,Y]=meshgrid(x,y);
>> Z=2*X.^2+2*Y.^2;
>> subplot(1,3,1), surf(Z), shading flat
>> title('FlatShading')
>> subplot(1,3,2), surf(Z), shading faceted
>> title('FacetedShading')
>> subplot(1,3,3), surf(Z), shading interp
>> title('InterpolatedShading')
![7.2.4.1 图形的着色方式]()
7.2.4.2 caxis命令
caxis([cmin cmax]) % 设置当前坐标区的颜色范围[cmin cmax],并依此为图形着色
caxis auto % 自动计算出色值的范围
caxis manual % 按照当前的色值范围设置色图范围
v=caxis % 返回当前色图范围的最大值和最小值[cmin cmax]
>> a=peaks(40);
>> surf(a)
>> caxis([-4 4])
![7.2.4.2 控制颜色显示范围]()
7.2.4.3 brighten命令
brighten(beta) % 增亮或变暗当前的色图。0<beta<1,增亮;-1<beta<0,变暗
brighten(map,beta) % 变换指定为map的色图的强度
newmap=brighten(___) % 没有改变当前图形的亮度,而是返回变化后的色图
>> a=peaks(40);
>> surf(a)
>> brighten(-0.2)
![7.2.4.3 亮度控制]()
7.2.4.4 colorbar命令
colorbar % 在当前坐标区或图的右侧显示一个垂直颜色标尺
colorbar('vert') % 增加一垂直的颜色标尺到当前的坐标轴中
colorbar('horiz') % 增加水平的颜色标尺到当前的坐标轴中
colorbar(location) % 在特定位置显示颜色标尺,如'northoutside'
colorbar(target,___) % 在target指定的坐标区或图上添加一个颜色标尺
colorbar('off') % 删除与当前坐标区或图关联的所有颜色标尺
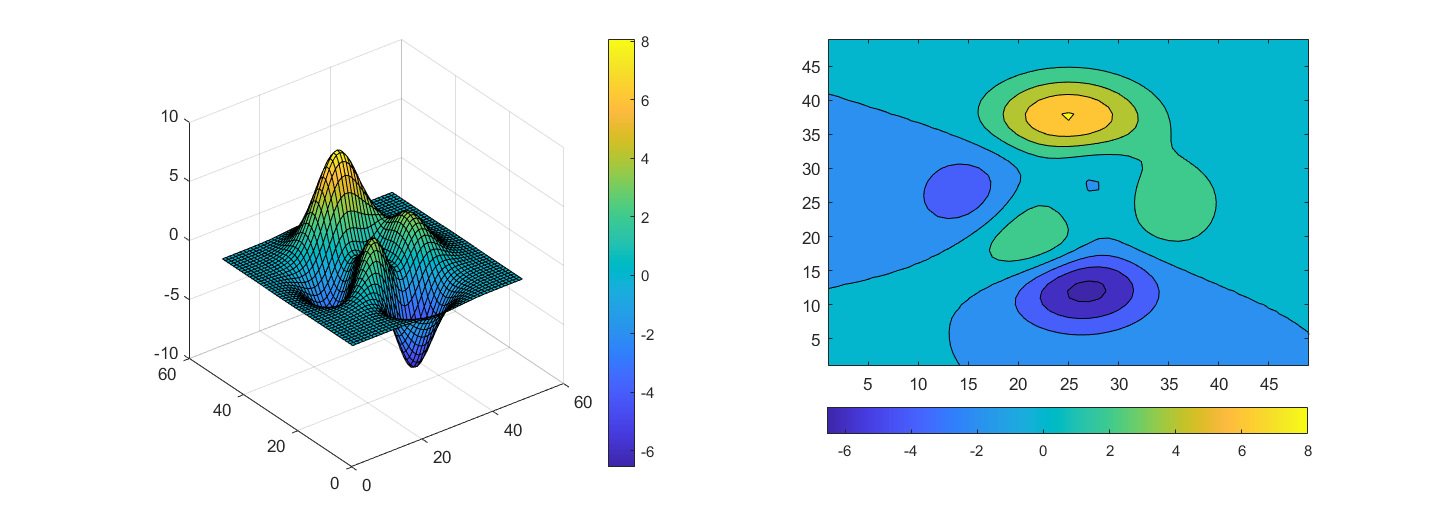
>> subplot(1,2,1), surf(peaks)
>> colorbar('vert')
>> subplot(1,2,2), contourf(peaks)
>> colorbar('southoutside') % 同colorbar('horiz')
![7.2.4.4 添加颜色标尺]()
7.2.4.5 colordef命令(即将被淘汰)
colordef white % 将图形背景颜色设置为白色
colordef black % 将图形背景颜色设置为黑色
colordef none % 将图形背景颜色和图形窗口颜色设置为系统默认颜色(黑色)
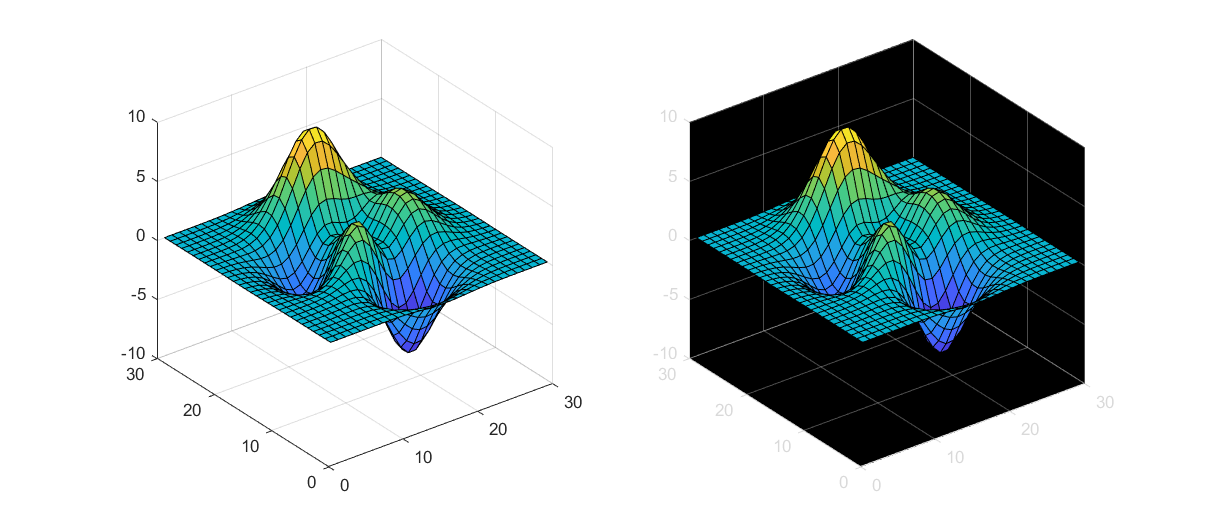
>> subplot(1,2,1), colordef white % 将图形背景颜色设为白色
警告: 以后的版本中将会删除 colordef。
>> a=peaks(30);
>> surf(a)
>> subplot(1,2,2), colordef black % 将图形背景颜色设为黑色
警告: 以后的版本中将会删除 colordef。
>> surf(a)
![7.2.4.5 设置图形背景颜色]()
7.2.5 光照控制
| 命令名 |
说明 |
命令名 |
说明 |
| light |
设置曲面光源 |
specular |
镜面反射模式 |
| surfl |
绘制存在光源的三维曲面图 |
diffuse |
漫反射模式 |
| lighting |
设置曲面光源模式 |
lightangle |
球坐标系中的光源 |
| material |
设置图形表面对光照的反映模式 |
— |
— |
7.2.5.1 light命令
light('PropertyName',PropertyValue,...) % 使用给定属性的指定值创建光源对象
>> surf(peaks)
>> light('Position',[-1 0 0],'Style','infinite');
![7.2.5.1 为图形设置光源]()
7.2.5.2 lighting命令
lighting flat % 该模式为平面模式,以网格为光照的基本单元。这是系统默认的模式
lighting gouraud % 该模式为点模式,以像素为光照的基本单元
lighting phong % 以像素为光照的基本单元,并计算各点的反射
lighting none % 关闭光源
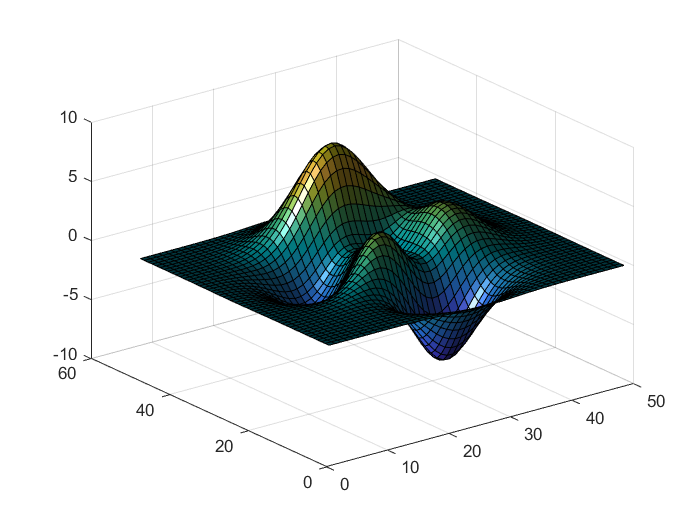
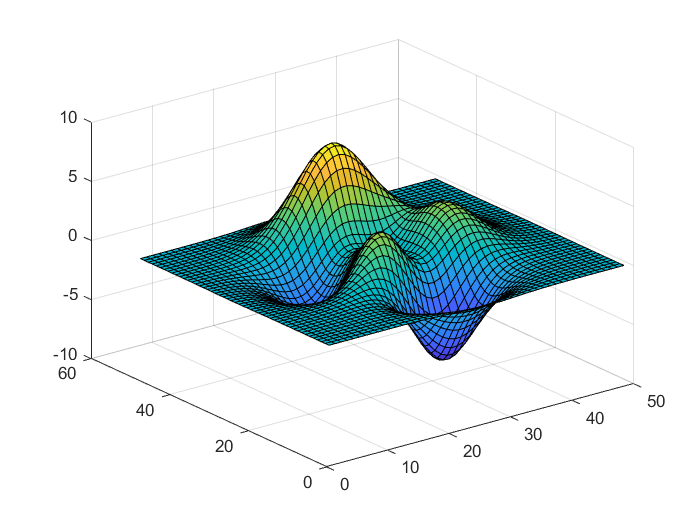
>> surf(peaks)
>> light('Position',[-1 0 0],'Style','infinite');
>> lighting gouraud
>> lighting none
![7.2.5.2 点模式显示]()
![7.2.5.2 关闭光源]()
7.2.5.3 material命令
material shiny % 使图形表面显示较光亮的色彩模式
material dull % 使图形表面显示较暗的色彩模式
material metal % 使图形表面呈现金属光泽的模式
material([ka kd ks]) % 设置对象的环境反射/漫反射/镜面反射模式的强度
material([ka kd ks n]) % n用于定义镜面反射的指数
material([ka kd ks n sc]) % sc用于定义镜面反射的颜色
7.3 图形窗口
7.3.1 图形窗口的创建
figure % 使用默认属性值创建一个新的图形窗口,并作为当前图形窗口
figure(Name,Value) % 使用一个或多个名称—值参数对修改图形窗口的属性
figure(f) % 将f指定的图形窗口作为当前图形窗口,并显示在最上方

get(h) % 返回句柄值为h的图形窗口的参数名称及其当前值
set(h) % 返回句柄值为h的图形窗口的参数名称及为这些参数设置的值
>> figure % 创建图形窗口
>> get(1) % 获取图形窗口属性
                 Alphamap: [0 0.0159 0.0317 0.0476 0.0635 0.0794 0.0952 0.1111 … ] (1×64 double)
             BeingDeleted: off
               BusyAction: 'queue'
            ButtonDownFcn: ''
                 Children: [0×0 GraphicsPlaceholder]
                 Clipping: on
          CloseRequestFcn: 'closereq'
                    Color: [0.9400 0.9400 0.9400]
                 Colormap: [256×3 double]
              ContextMenu: [0×0 GraphicsPlaceholder]
                CreateFcn: ''
              CurrentAxes: [0×0 GraphicsPlaceholder]
         CurrentCharacter: ''
            CurrentObject: [0×0 GraphicsPlaceholder]
             CurrentPoint: [0 0]
                DeleteFcn: ''
             DockControls: on
                 FileName: ''
        GraphicsSmoothing: on
         HandleVisibility: 'on'
                     Icon: ''
            InnerPosition: [1457 445.8000 560 420.0000]
            IntegerHandle: on
            Interruptible: on
           InvertHardcopy: on
              KeyPressFcn: ''
            KeyReleaseFcn: ''
                  MenuBar: 'figure'
                     Name: ''
                 NextPlot: 'add'
                   Number: 1
              NumberTitle: on
            OuterPosition: [1.4498e+03 438.6000 574.4000 508.8000]
         PaperOrientation: 'portrait'
            PaperPosition: [3.0917 9.2937 14.8167 11.1125]
        PaperPositionMode: 'auto'
                PaperSize: [21.0000 29.7000]
                PaperType: 'A4'
               PaperUnits: 'centimeters'
                   Parent: [1×1 Root]
                  Pointer: 'arrow'
        PointerShapeCData: [16×16 double]
      PointerShapeHotSpot: [1 1]
                 Position: [1457 445.8000 560 420.0000]
                 Renderer: 'opengl'
             RendererMode: 'auto'
                   Resize: on
               Scrollable: off
            SelectionType: 'normal'
           SizeChangedFcn: ''
                      Tag: ''
                  ToolBar: 'auto'
                     Type: 'figure'
                    Units: 'pixels'
                 UserData: []
                  Visible: on
      WindowButtonDownFcn: ''
    WindowButtonMotionFcn: ''
        WindowButtonUpFcn: ''
        WindowKeyPressFcn: ''
      WindowKeyReleaseFcn: ''
     WindowScrollWheelFcn: ''
              WindowState: 'normal'
              WindowStyle: 'normal'
7.3.2 图形的打印与输出
print(fname,ftype) % 使用指定的文件格式将当前图形窗口保存到文件中
print(fname,ftype,foptions) % 指定可用于某些格式的其他选项
print % 将当前图形窗口输出到默认打印机中
print(printer) % 指定打印机,包含以-P开头的打印机名称
print(driver) % 指定驱动程序
print(printer,driver) % 指定打印机和驱动程序
print('-clipboard',clipboardformat) % 使用指定格式将当前图形窗口复制到剪切板


 浙公网安备 33010602011771号