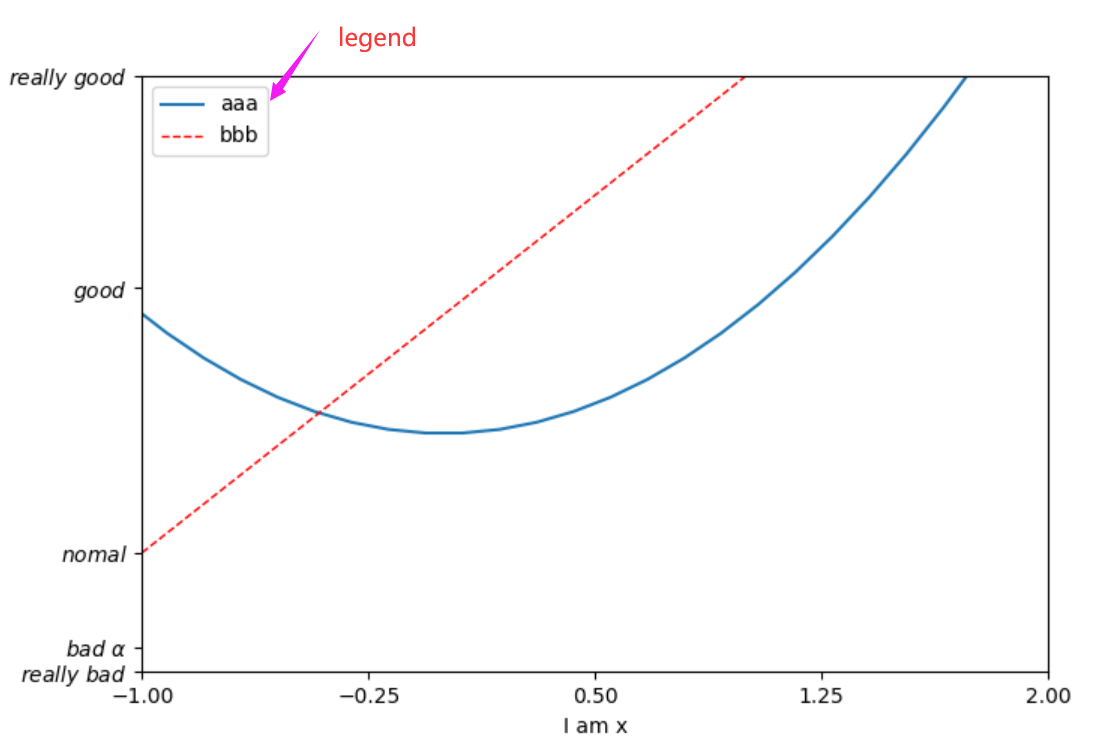
设置legend图例
 1 import matplotlib.pyplot as plt
 2 import numpy as np
 3
 4
 5 x = np.linspace(-3,3,50)
 6 y1 = 2*x+1
 7 y2 = x**2
 8
 9 plt.figure()
10
11
12 plt.xlim((-1,2)) #设置x轴的范围
13 plt.ylim((-2,3)) #设置y轴的范围
14 plt.xlabel('I am x') #设置x轴的label
15 plt.ylabel('I am y')#设置y轴label
16
17 new_ticks = np.linspace(-1,2,5)
18 print(new_ticks)
19 plt.xticks(new_ticks) #设置x轴间隔ticks
20 plt.yticks([-2,-1.8,-1,1.22,3],  #y轴ticks一一对应
21            [r'$really\ bad$',r'$bad\ \alpha$',r'$nomal$',r'$good$',r'$really\ good$'])
22
23 l1, = plt.plot(x,y2,label='up') #如果想传到handles中去一定要加一个逗号
24 l2, = plt.plot(x,y1,color='red',linewidth=1.0,linestyle='--',label='down')
25 plt.legend(handles=[l1,l2],labels=['aaa','bbb'],loc='best')
26
27 plt.show()