【ECharts,仪表盘样式1】
本文内容均来自于百度搜索,
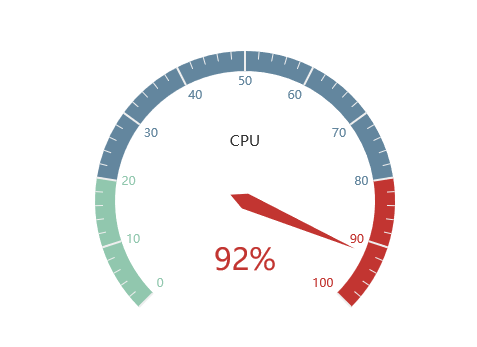
全局代码:
 1 <!DOCTYPE html PUBLIC "-//W3C//DTD XHTML 1.0 Transitional//EN" "http://www.w3.org/TR/xhtml1/DTD/xhtml1-transitional.dtd">
 2 <html xmlns="http://www.w3.org/1999/xhtml">
 3         <head>
 4         <meta http-equiv="Content-Type" content="text/html; charset=utf-8" />
 5         <title>无标题文档</title>
 6         <script  src="js/echarts.js"></script>
 7     </head>
 8
 9     <body>
10         <div id="main" style="width:600px;height:400px;"></div>
11     </body>
12     <script type="text/javascript">
13             var myChart = echarts.init(document.getElementById('main'));
14
15             option = {
16
17                 tooltip : {
18                     formatter: "{a} <br/>{b} : {c}%"
19                 },
20                 series : [
21                     {
22                         name:'业务指标',
23                         type:'gauge',
24                         detail : {formatter:'{value}%'}, //仪表盘显示数据
25                         axisLine: { //仪表盘轴线样式
26                             lineStyle: {
27                                 width: 20
28                             }
29                         },
30                         splitLine: { //分割线样式
31                             length: 20
32                         },
33                         data:[{value: 92, name: 'CPU'}],
34
35
36                     }
37
38                 ]
39             };
40
41             myChart.setOption(option);
42     </script>
43 </html>
我们在中间点添加一个白点
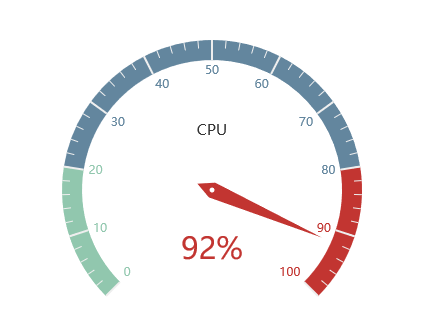
全局代码:
 1 <!DOCTYPE html PUBLIC "-//W3C//DTD XHTML 1.0 Transitional//EN" "http://www.w3.org/TR/xhtml1/DTD/xhtml1-transitional.dtd">
 2 <html xmlns="http://www.w3.org/1999/xhtml">
 3         <head>
 4         <meta http-equiv="Content-Type" content="text/html; charset=utf-8" />
 5         <title>无标题文档</title>
 6         <script  src="js/echarts.js"></script>
 7     </head>
 8
 9     <body>
10         <div id="main" style="width:600px;height:400px;"></div>
11     </body>
12     <script type="text/javascript">
13             var myChart = echarts.init(document.getElementById('main'));
14
15             option = {
16
17                 tooltip : {
18                     formatter: "{a} <br/>{b} : {c}%"
19                 },
20                 series : [
21                     {
22                         name:'业务指标',
23                         type:'gauge',
24                         detail : {formatter:'{value}%'}, //仪表盘显示数据
25                         axisLine: { //仪表盘轴线样式
26                             lineStyle: {
27                                 width: 20
28                             }
29                         },
30                         splitLine: { //分割线样式
31                             length: 20
32                         },
33                         data:[{value: 92, name: 'CPU'}],
34
35                         markPoint:{
36                             symbol:'circle',
37                             symbolSize:5,
38                             data:[
39                                 //跟你的仪表盘的中心位置对应上,颜色可以和画板底色一样
40                                 {x:'center',y:'center',itemStyle:{color:'#FFF'}}
41                                 ]
42                         },
43                     }
44
45                 ]
46             };
47
48             myChart.setOption(option);
49     </script>
50 </html>

 浙公网安备 33010602011771号