[k8s]dashboard1.8.1搭建( heapster1.5+influxdb+grafana)
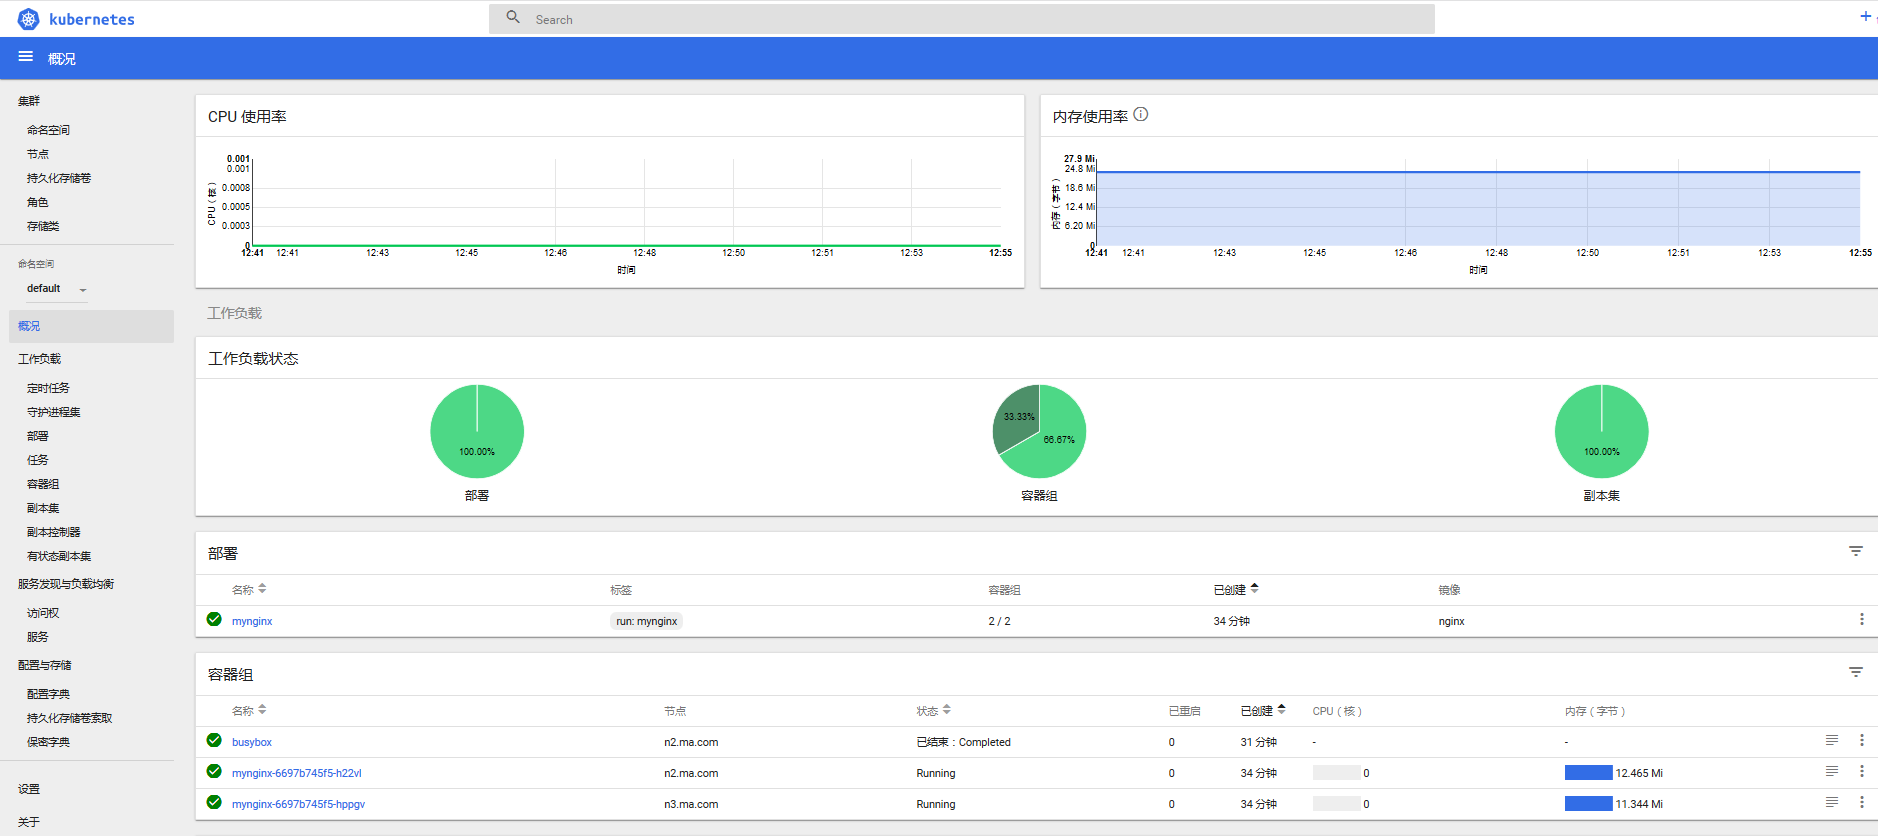
dashboard最终效果
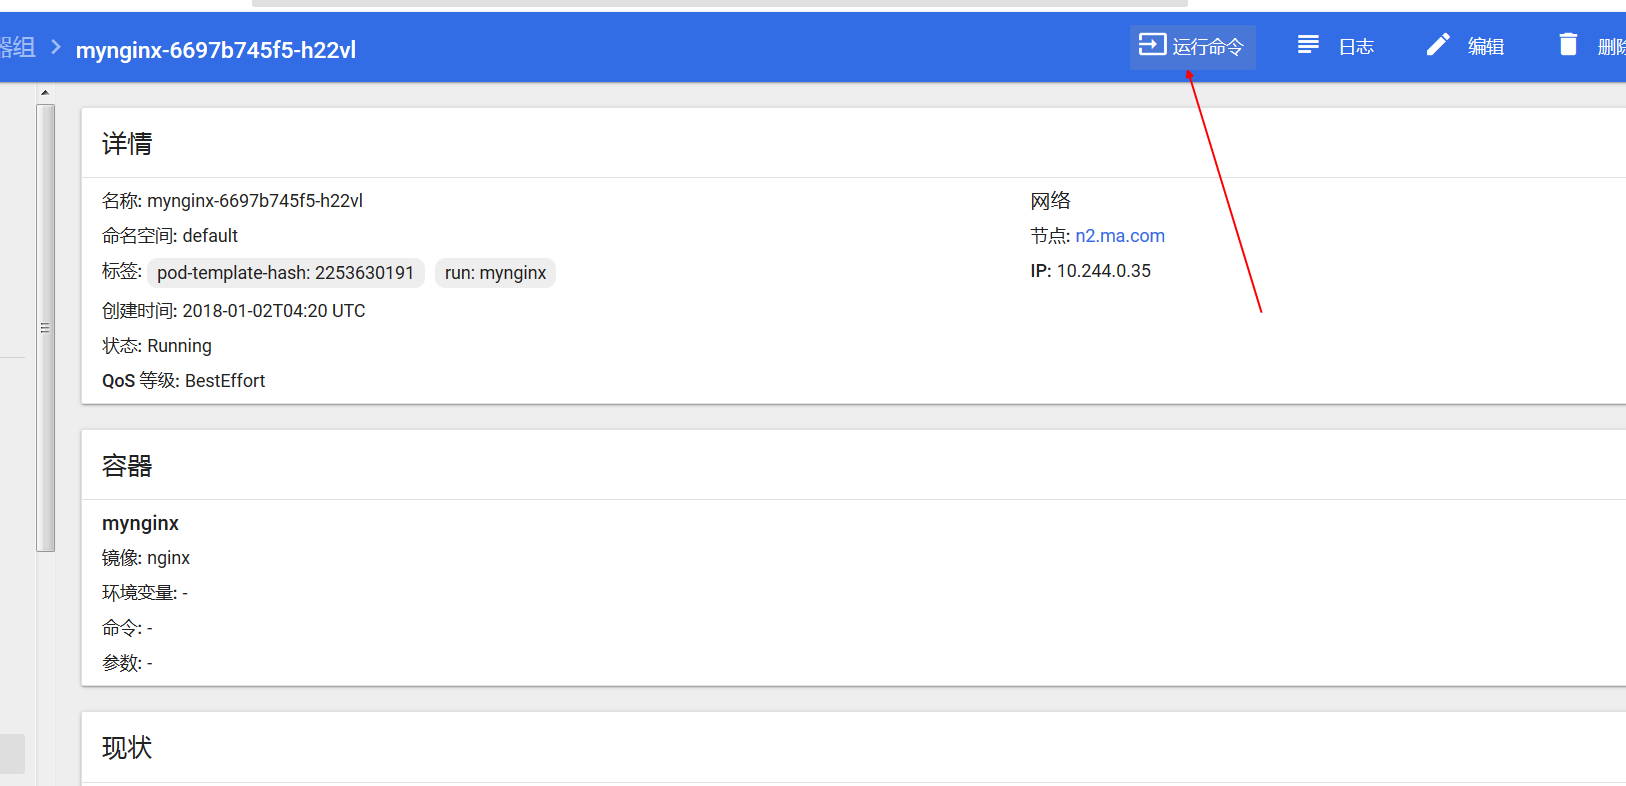
多了执行sh的窗口
heapster+influxdb+grafana搭建
整个架构是 dashboard去检测 hepster service服务, heapster通过cadvisor搜集到数据入库到influxdb. 而dashboard访问heapster的svc的8086端口获取数据绘图.
准备yaml
https://github.com/kubernetes/heapster/blob/master/deploy/kube-config/influxdb

[root@n1 influxdb]# tree .
.
├── grafana.yaml
├── heapster.yaml
└── influxdb.yaml
修改镜像并创建
[root@n1 influxdb]# grep -r image: .
./influxdb.yaml:        image: lanny/k8s.gcr.io_heapster-influxdb-amd64:v1.3.3
./grafana.yaml:        image: lanny/k8s.gcr.io_heapster-grafana-amd64:v4.4.3
./heapster.yaml:        image: lanny/gcr.io_google_containers_heapster-amd64:v1.5.0

注: 这里用v1.5.0的heapster.看release用最新的,官方的yaml可能还是旧的
dashboard1.8.1
部署dashboard 1.8.1
https://github.com/kubernetes/dashboard/releases
dashboard.yaml
apiVersion: extensions/v1beta1
kind: Deployment
metadata:
  labels:
    app: kubernetes-dashboard
  name: kubernetes-dashboard
  namespace: kube-system
spec:
  replicas: 1
  selector:
    matchLabels:
      app: kubernetes-dashboard
  template:
    metadata:
      labels:
        app: kubernetes-dashboard
      # Comment the following annotation if Dashboard must not be deployed on master
      annotations:
        scheduler.alpha.kubernetes.io/tolerations: |
          [
            {
              "key": "dedicated",
              "operator": "Equal",
              "value": "master",
              "effect": "NoSchedule"
            }
          ]
    spec:
      containers:
      - name: kubernetes-dashboard
        image: lanny/gcr.io_google_containers_kubernetes-dashboard-amd64:v1.8.1
        imagePullPolicy: IfNotPresent
        ports:
        - containerPort: 9090
          protocol: TCP
        args:
          # Uncomment the following line to manually specify Kubernetes API server Host
          # If not specified, Dashboard will attempt to auto discover the API server and connect
          # to it. Uncomment only if the default does not work.
          # - --apiserver-host=http://my-address:port
           - --apiserver-host=http://192.168.x.x:8080
           - --heapster-host=http://heapster  #要有这玩意,不然创建后可能heapster检查失败,导致ui不显示图形.
        livenessProbe:
          httpGet:
            path: /
            port: 9090
          initialDelaySeconds: 30
          timeoutSeconds: 30
---
kind: Service
apiVersion: v1
metadata:
  labels:
    app: kubernetes-dashboard
  name: kubernetes-dashboard
  namespace: kube-system
spec:
  type: NodePort
  ports:
  - port: 80
    targetPort: 9090
  selector:
    app: kubernetes-dashboard
出现的问题
ui图形不展示
dashboard的日志: dashboard会去连heapster的8082端口获取数据来展示图形. 这里看到heapster连不上,但是heapster的日志没问题
2018/01/02 04:14:29 Metric client health check failed: an error on the server ("Error: 'dial tcp 10.244.1.43:8082: getsockopt: connection refused'\nTrying to reach: 'http://10.244.1.43:8082/healthz'") has prevented the request from succeeding (get services heapster). Retrying in 30 seconds.
2018/01/02 04:15:20 Metric client health check failed: an error on the server ("Error: 'dial tcp 10.244.1.43:8082: getsockopt: connection refused'\nTrying to reach: 'http://10.244.1.43:8082/healthz'") has prevented the request from succeeding (get services heapster). Retrying in 30 seconds.
2018/01/02 04:16:11 Metric client health check failed: an error on the server ("Error: 'dial tcp 10.244.1.43:8082: getsockopt: connection refused'\nTrying to reach: 'http://10.244.1.43:8082/healthz'") has prevented the request from succeeding (get services heapster). Retrying in 30 seconds.
解决: dashboard的yaml加- --heapster-host=http://heapster 参数即可
参考: https://github.com/kubernetes/dashboard/issues/1602
创建dashboard后,访问不出现ui
我用参考官网的https://raw.githubusercontent.com/kubernetes/dashboard/v1.8.1/src/deploy/recommended/kubernetes-dashboard.yaml
发现这个毛病,所有用了1.7的yaml,暂时没去深究.

 浙公网安备 33010602011771号