MiniProfiler.EF6监控调试MVC5和EF6的性能
转载自:https://www.lanhusoft.com/Article/125.html
以前开发Webform的时候可以开启trace来跟踪页面事件,这对于诊断程序的性能是有很大的帮助的,起到事半功倍的作用,今天我就来谈用mvc开发项目的调试和性能监控。EF框架自动给我生成sql语句,当我们的程序遇到性能问题的时候我们可以用MiniProfiler.EF来监控调试MVC和EF的性能,查看生成的sql语句、运行了哪些sql,以及所花的时间。MiniProfiler.EF,一个轻量级开源的mvc性能调试、监控组件MiniProfiler专门为EF定制的版本。下面通过一个具体一例子的说明怎么在我们的项目中用MiniProfiler.EF6监控调试MVC和EF的性能。
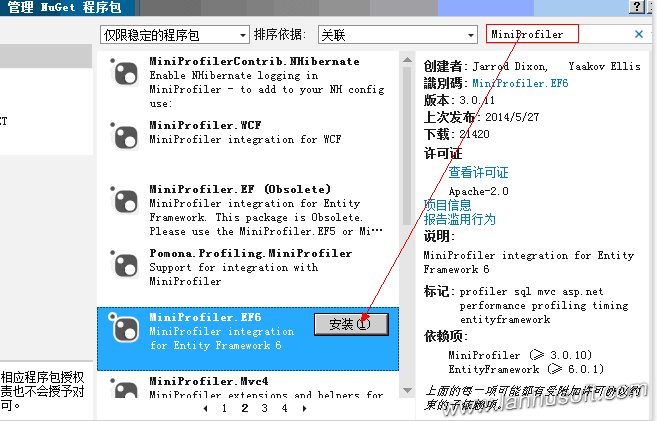
1、安装MiniProfiler.EF6
在nuget搜索框中输入MiniProfiler,将出现下面结果:
2、添加MiniProfiler.EF相关代码到项目里面
1、在Global.asax加入MiniProfiler相关的监控代码
修改之后完整内容为:
using System.Web.Mvc;
using System.Web.Optimization;
using System.Web.Routing;
using StackExchange.Profiling;
using StackExchange.Profiling.EntityFramework6;
namespace MiniProfilerDemo
{
    public class MvcApplication : System.Web.HttpApplication
    {
        protected void Application_Start()
        {
            AreaRegistration.RegisterAllAreas();
            FilterConfig.RegisterGlobalFilters(GlobalFilters.Filters);
            RouteConfig.RegisterRoutes(RouteTable.Routes);
            BundleConfig.RegisterBundles(BundleTable.Bundles);
            MiniProfilerEF6.Initialize();
        }
        protected void Application_BeginRequest()
        {
            MiniProfiler.Start();
        }
        protected void Application_EndRequest()
        {
            MiniProfiler.Stop();
        }
    }
}
其中是在Application_Start加入了MiniProfilerEF6.Initialize()和添加了Application_BeginRequest、Application_BeginRequest两个Application的事件函数,这个的作用分别是初始化MiniProfilerEF6和开始、结束MiniProfiler监控。
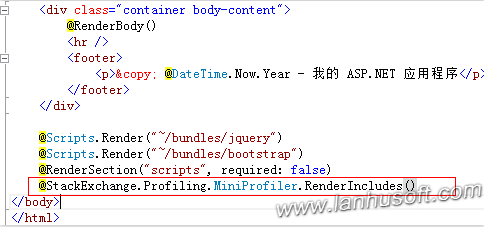
2、修改_Layout.cshtml视图文件
在Views\Shared\_Layout.cshtml文件的body前面加上一段代码,让监控展示在页面上。
@StackExchange.Profiling.MiniProfiler.RenderIncludes()
如下图:
3、在Web.config加入代码
<system.webServer>
    <handlers>
      <add name="MiniProfiler" path="mini-profiler-resources/*" verb="*" type="System.Web.Routing.UrlRoutingModule" resourceType="Unspecified" preCondition="integratedMode" />
    </handlers>
</system.webServer>
为了要在页面上显示MVC和EF的调试跟踪时间必须要加入上面的代码。如下图:
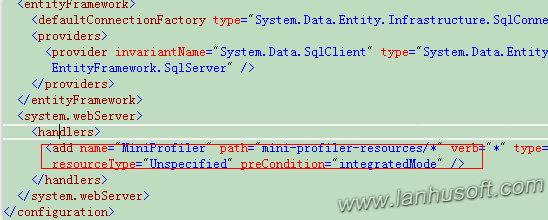
在system.webServer配置结点下的handlers结点,加入了一个名为MiniProfiler的handler。
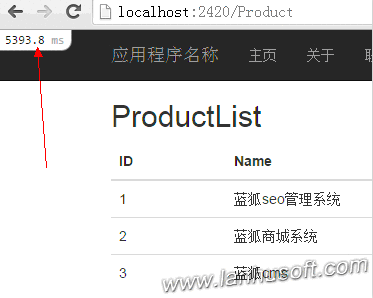
3、查看运行结果
4、细微监控方法内部的时间
现在我们为ProductController加上监控,监控获取从数据库中获取Product记录所花的时间。我们把ProductController修改为:
using MiniProfilerDemo.DAL;
using System.linq;
using System.Web.Mvc;
using StackExchange.Profiling;
using System.Collections.Generic;
using MiniProfilerDemo.Models;
namespace MiniProfilerDemo.Controllers
{
    public class ProductController : Controller
    {
        public ActionResult Index()
        {
            using (EFDbContext db = new EFDbContext())
            {
                var profiler = MiniProfiler.Current;
                List<Product> m;
                using (profiler.Step("获取Product列表"))
                {
                    m = db.Products.ToList();
                }
                return View(m);
            }
        }
    }
}
重新生成项目,再次运行查看页面,如下图:
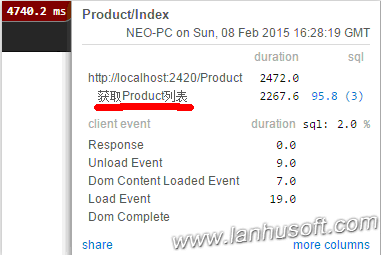
可以看到上面多了我们刚才手动加的“获取Product列表”条记录。这样可以细微监控方法内部的时间,方便、快速地帮我们找出我们的程序的瓶颈所在。

 浙公网安备 33010602011771号