Spring boot admin 节点状态一直为DOWN的排查
项目中需要监控各个微服务节点的健康状态,找到了spring boot admin这个全家桶监控工具,它其实是Vue.js美化过的Spring Boot Actuator,官方的解释是:
codecentric’s Spring Boot Admin is a community project to manage and monitor your Spring Boot ® applications. The applications register with our Spring Boot Admin Client (via HTTP) or are discovered using Spring Cloud ® (e.g. Eureka, Consul). The UI is just a Vue.js application on top of the Spring Boot Actuator endpoints.
它有两种使用方式,一种是客户端主动连接服务端,另一种是基于Spring Cloud Discovery(Eureka、Consul、Zookeeper等),因为项目里已经集成了Eureka,所以采用第二种方式搭建。
个人觉得官方文档并不是十分的友好,推荐这个详细搭建的步骤供大家参考:
https://juejin.im/post/5c34bcfdf265da615b71a3a8
运行成功后有一个服务节点一直显示为DOWN,访问http://127.0.0.1/actuator/health返回
{"status":"DOWN"}
其他节点正常。
在显示DOWN的客户端添加如下配置:
management:
  endpoints:
    web:
      exposure:
        include: "*" #暴露所有节点
    health:
      sensitive: false #关闭过滤敏感信息
  endpoint:
    health:
      show-details: ALWAYS  #显示详细信息
再次访问访问 http://127.0.0.1/actuator/health ,返回:
{
  "status":"DOWN",
  "diskSpace":{
    "status":"DOWN",
    "total":16579448832,
    "free":20480,
    "threshold":10485760
  },
  "db":{
    "status":"UP",
    "database":"H2",
    "biz":1
  }
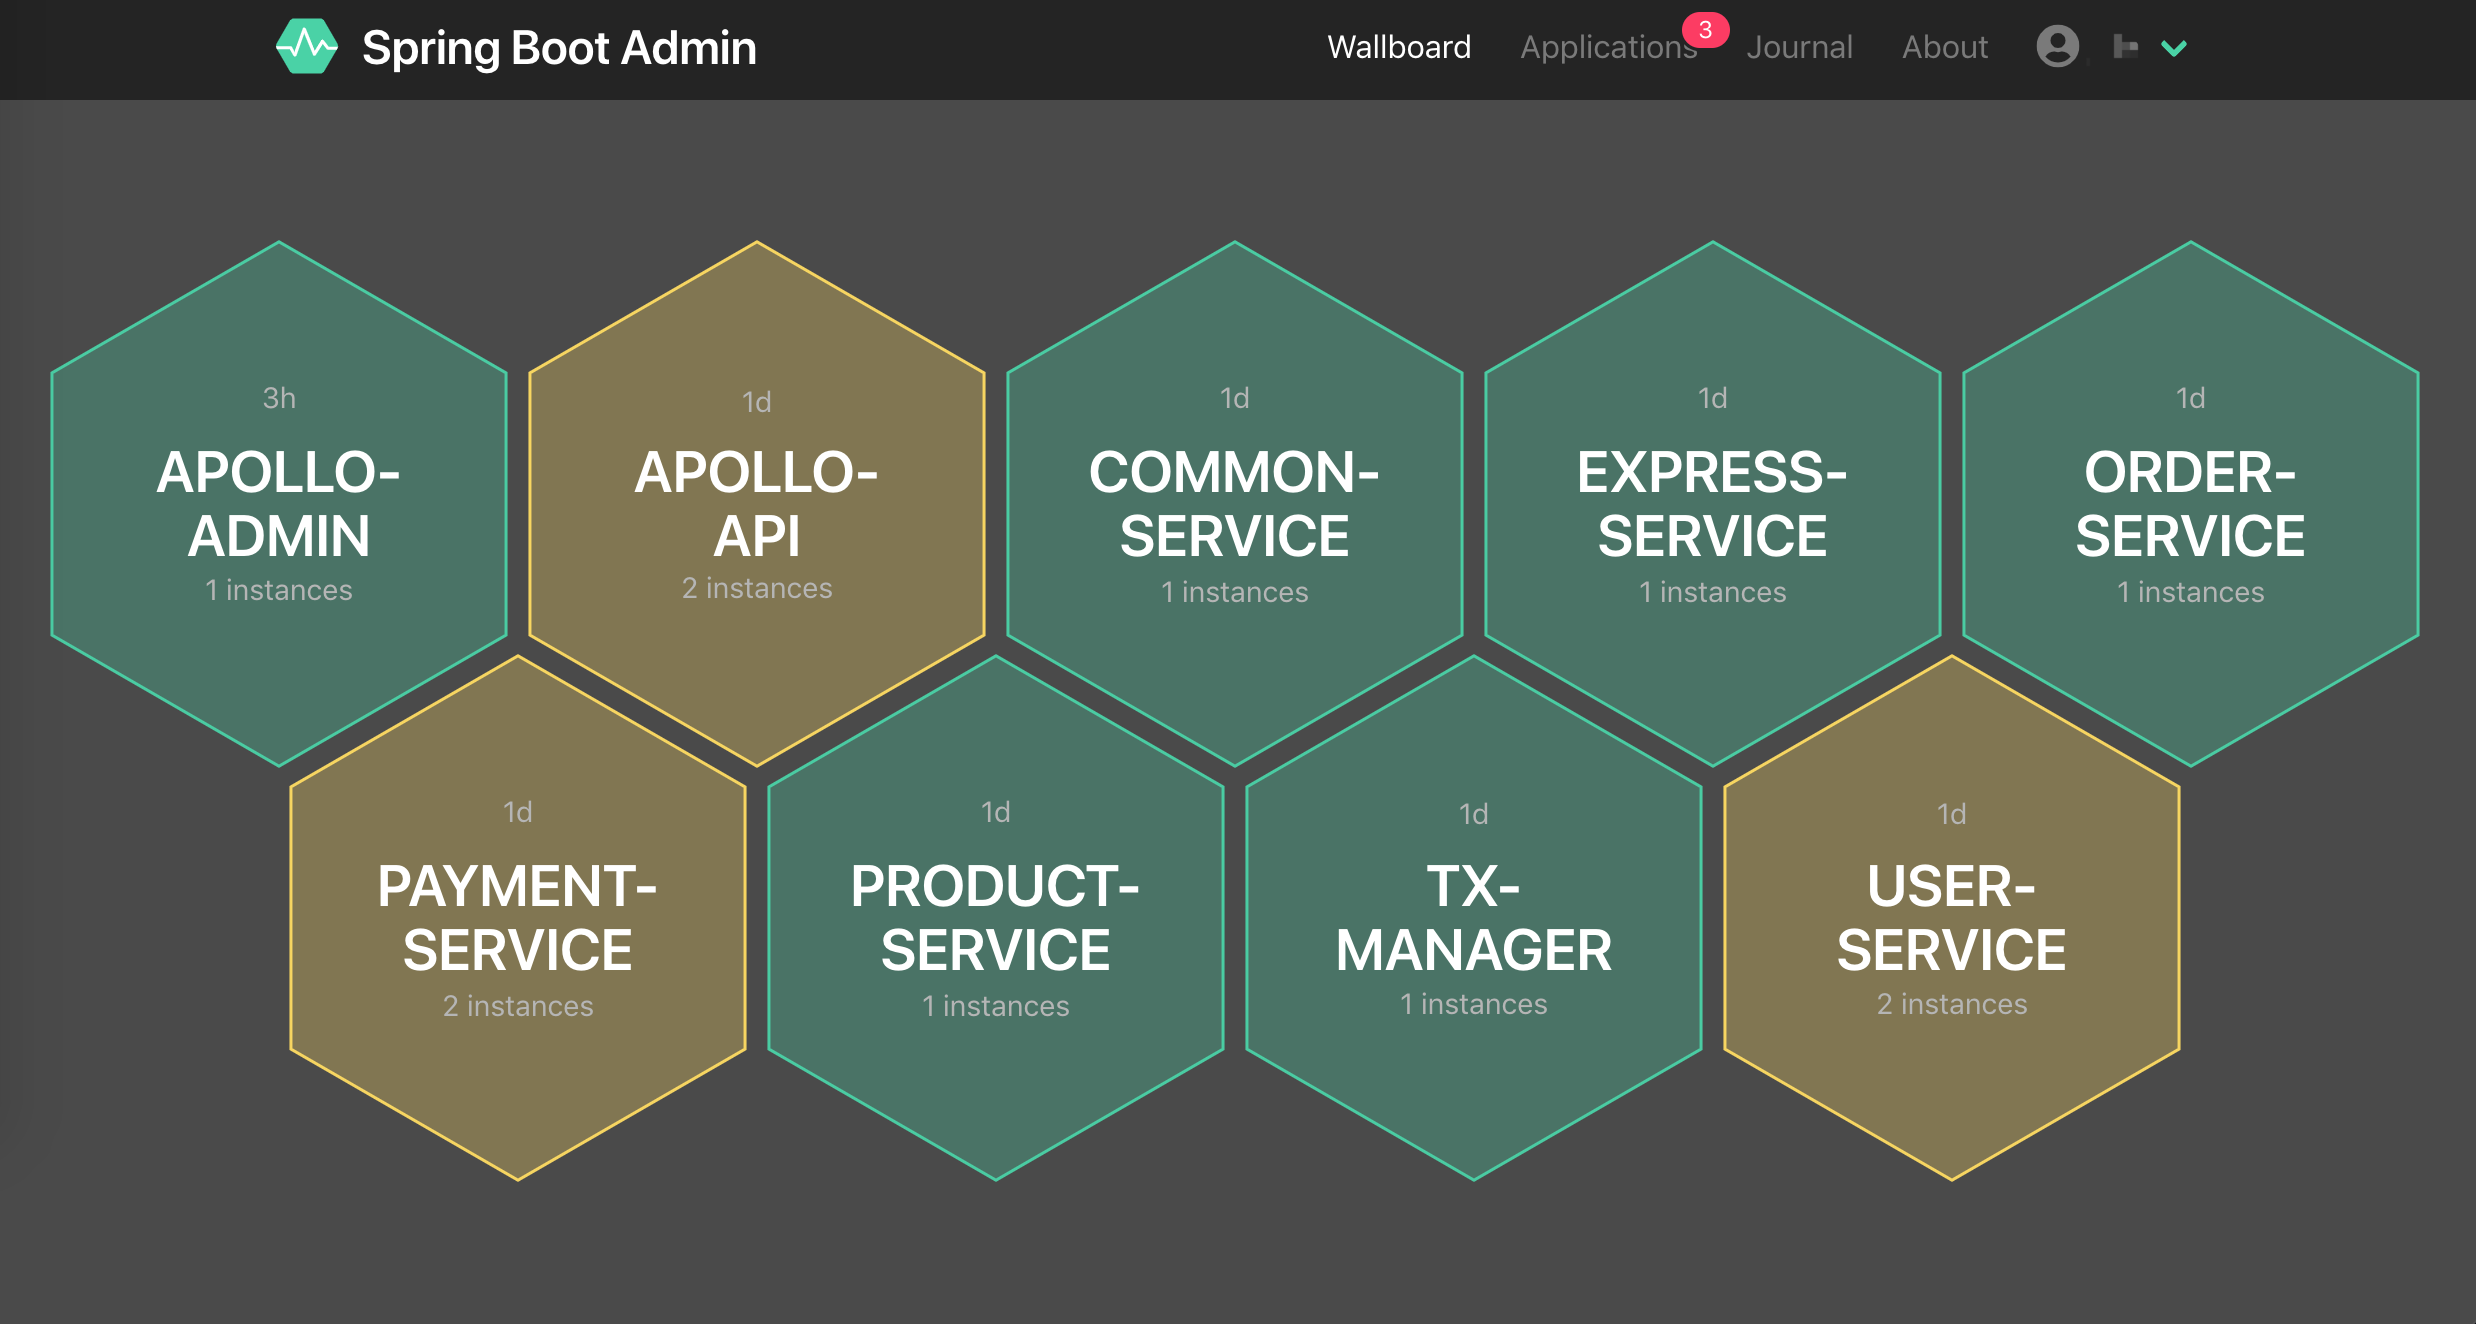
原来是磁盘空间不足,处理后所有监控节点都为UP正常状态。(黄色的有本地启动的instance,可忽略)
这里要注意一下,只要其中一个监控内容为DOWN,则该节点的总体状态就为DOWN。
参考链接:
http://codecentric.github.io/spring-boot-admin/2.1.2/
https://github.com/codecentric/spring-boot-admin
https://juejin.im/post/5c34bcfdf265da615b71a3a8
https://github.com/forezp/SpringCloudLearning/tree/master/sc-f-boot-admin-cloud

 浙公网安备 33010602011771号