读取数据搞cluster
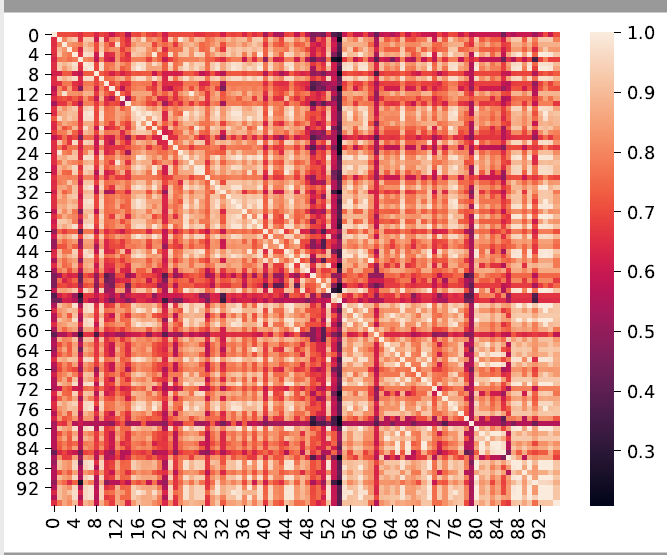
这是原本的数据。
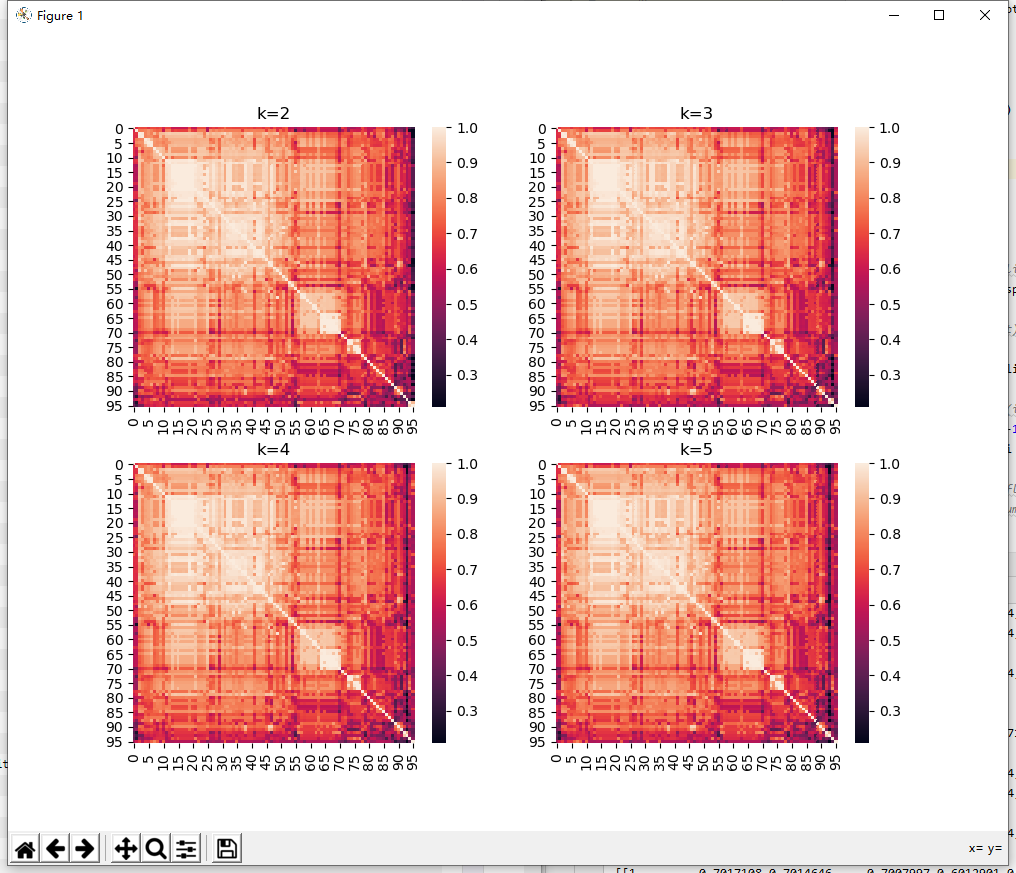
这是组合之后的数据
import matplotlib.pyplot as plt
import scipy
import seaborn as sns
import sys
import numpy as np
f=open(sys.argv[1],"r")
i=0
n=0
wanted=5
data=[]
line=f.readline()
while line:
    if i>0:# Now reading the data in the matrix
        #print(line.split())
        str_list=line.split("\t")
        #print(i)
        #print(str_list)
        j=0
        for tt in str_list:
            if j>0:
                #print(i,j,tt)
                data[i-1][j-1]=(float(tt))#set the data into array
                data1[i - 1][j - 1] = (float(tt))#another one
            j+=1
        #num=list(map(float,line.split()))
        #data.append(num)
        #print(num)
    else:#when i=0, the program read the name of each sequence
        line=line.strip(" ")
        str_list=line.split("\t")
        for qwe in str_list:
            if qwe.isspace()==True or qwe=='':
                str_list.remove(qwe)
        print("numm=",len(str_list))
        numm=len(str_list)
        print((str_list))
        data=np.zeros((numm,numm))
        data1 = np.zeros((numm, numm))
    i+=1
    line = f.readline()

visited=np.zeros(numm)
cluster=[]
for i in range(numm):
    cluster.append([i])
    visited[i]=1
#cluster[i] is the set of the sequences in this cluster
# visited[i]=1 means it's available 0 means not available and cluster[i] will not be used anymore
clusternum=numm#how many clusters available now
#print (cluster)
fig = plt.figure(figsize=(10,8))#the size of the window for figure
while clusternum>1 :
    maxx=-0.1
    maxpos1=-1
    maxpos2=-1
    for i in range(numm):
        for j in range(i+1,numm):
            if data1[i][j]>maxx and visited[i]+visited[j]==2:
                maxx=data1[i][j]
                maxpos1=i
                maxpos2=j
    #find the greatest proximity
    #print(cluster[maxpos1])
    #print(cluster[maxpos2])
    cluster[maxpos1].extend(cluster[maxpos2])#combine these two clusters into one
    #print (cluster[maxpos1])
    visited[maxpos2]=0#the cluster combined with bigger i will not availble any more
    s=0.0
    for i in range(numm):#calculate and update the new proximity with other cluster
        if visited[i]==1:
            s=0.0
            for j in cluster[maxpos1]:
                for k in cluster[i]:
                    #print(j,k)
                    #print("data",data[j][k])
                    s+=float(data[j][k])
            s=(s/len(cluster[maxpos1]))/len(cluster[i])
            #print("s=",s)

            data1[i][maxpos1]=s
            data1[maxpos1][i]=s
    clusternum-=1
    if(clusternum<=5 and clusternum>=2):#print the heatmap when 2<=k<=5
        sss=[]
        for i in range(numm):
            if(visited[i]==True):
                sss.extend(cluster[i])
                print(i,len(cluster[i]),cluster[i])
        print(sss)
        newma=np.zeros((numm,numm))
        for i in range(numm):
            for j in range (numm):
                newma[i][j]=data[sss[i]][sss[j]]

        ax=fig.add_subplot(2,2,clusternum-1)
        ax.set_title('k='+str(clusternum))

        sns_plot = sns.heatmap(newma)
        #sns_plot.set_title("k=",clusternum)
fig.savefig("new.pdf", bbox_inches='tight') # 减少边缘空白

print(data)
print(newma)
plt.show()

 浙公网安备 33010602011771号