

话不多说,先看图,这是导入一张图后运行的效果。
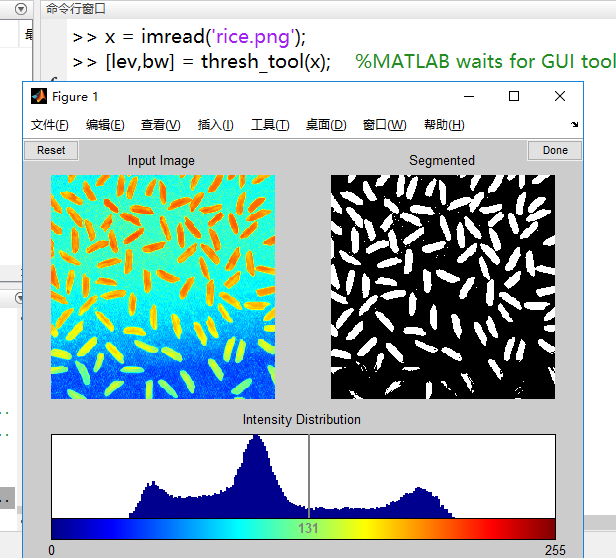
在此函数中,左图是灰度图加上colorBar后的彩色效果图,右图是二值化后的图,下面是可调节阈值的灰度直方图。
左上角的按钮是回归初始状态,右上角的按钮是结束阈值调整并记录该阈值和所得的二值化图像。
该函数先计算一个自适应阈值,若你不满意可以拉动灰度直方图的阈值灰色竖线左右移动,图像就会根据你的阈值选择变化。
很好用的一个工具,下面放代码。
function [level,bw] = thresh_tool(im,cmap,defaultLevel) %mainfunction
%THRESH_TOOL  Interactively select intensity level for image thresholding.
%   THRESH_TOOL launches a GUI (graphical user interface) for thresholding
%   an intensity input image, IM. IM is displayed in the top left corner. A
%   colorbar and IM's histogram are displayed on the bottom. A line on the
%   histogram indicates the current threshold level. A binary image is
%   displayed in the top right based on the selected level.  To change the
%   level, click and drag the line. The output image updates automatically.
%
%   There are two ways to use this tool.
%
%Mode 1 - nonblocking behavior:
%   THRESH_TOOL(IM) launches GUI tool.  You can continue using the MATLAB
%   Desktop.  Since no results are needed, the function does not block
%   execution of other commands.
%
%   THRESH_TOOL(IM,CMAP) allows the user to specify the colormap, CMAP.  If
%   not specified, the default colormap is used.
%
%   THRESH_TOOL(IM,CMAP,DEFAULTLEVEL) allows the user to specify the
%   default threshold level. If not specified, DEFAULTLEVEL is determined
%   by GRAYTHRESH. Valid values for DEFAULTLEVEL must be consistent with
%   the data type of IM for integer intensity images: uint8 [0,255], uint16
%   [0,65535], int16 [-32768,32767].
%
%   Example
%       x = imread('rice.png');
%       thresh_tool(x)          %no return value, so MATLAB keeps running
%
%Mode 2 - blocking behavior:
%   LEVEL = THRESH_TOOL(...) returns the user selected level, LEVEL, and
%   MATLAB waits for the result before proceeding.  This blocking behavior
%   mode allows the tool to be inserted into an image processing algorithm
%   to support an automated workflow.
%
%   [LEVEL,BW] = THRESH_TOOL(...) also returns the thresholded binary
%   output image, BW.
%
%   Example
%       x = imread('rice.png');
%       lev = thresh_tool(x)    %MATLAB waits for GUI tool to finish
%
%See also COLORMAP, GRAYTHRESH, IM2BW.

if ndims(im)== 3
    im = rgb2gray(im);
end


%defensive programming
error(nargchk(1,3,nargin))
error(nargoutchk(0,2,nargout))

%validate defaultLevel within range
if nargin>2 %uer specified DEFAULTLEVEL
  dataType = class(im);
  switch dataType
    case 'uint8','uint16','int16'
      if defaultLevel<intmin(dataType) | defaultLevel>intmax(dataType)
        error(['Specified DEFAULTLEVEL outside class range for ' dataType])
      elseif defaultLevel<min(im(:)) | defaultLevel>max(im(:))
        error('Specified DEFAULTLEVEL outside data range for IM')
      end
    case 'double','single'
      %okay, do nothing
    otherwise
      error(['Unsupport image type ' dataType])
  end %switch
end

max_colors=1000;    %practical limit

%calculate bins centers
color_range = double(limits(im));
if isa(im,'uint8') %special case [0 255]
  color_range = [0 255];
  num_colors = 256;
  di = 1;
elseif isinteger(im)
  %try direct indices first
  num_colors = diff(color_range)+1;
  if num_colors<max_colors %okay
    di = 1;                                 %inherent bins
  else %too many levels
    num_colors = max_colors;                %practical limit
    di = diff(color_range)/(num_colors-1);
  end
else %noninteger
  %try infering discrete resolution first (intensities often quantized)
  di = min(diff(sort(unique(im(:)))));
  num_colors = round(diff(color_range)/di)+1;
  if num_colors>max_colors %too many levels
    num_colors = max_colors;                %practical limit
    di = diff(color_range)/(num_colors-1);
  end
end
bin_ctrs = [color_range(1):di:color_range(2)];
FmtSpec = ['%.' num2str(ceil(-log10(di))) 'f'];

%new figure - interactive GUI tool for level segmenting
h_fig = figure;
set(h_fig,'ToolBar','Figure')
if nargin>1 && isstr(cmap) && strmatch(lower(cmap),'gray')
  full_map = gray(num_colors);
elseif nargin>1 && isnumeric(cmap) && length(size(cmap))==2 && size(cmap,2)==3
  full_map = cmap;
else
  full_map = jet(num_colors);
end
setappdata(h_fig,'im',im)
setappdata(h_fig,'FmtSpec',FmtSpec)

%top left - input image
h_ax1 = axes('unit','norm','pos',[0.05 0.35 0.4 0.60]);
rgb = im2rgb(im,full_map);
  function rgb = im2rgb(im,full_map); %nested
    %coerce intensities into gray range [0,1]
    gray = imadjust(im,[],[0 1]);
    %generate indexed image
    num_colors = size(full_map,1);
    ind = gray2ind(gray,num_colors);
    %convert indexed image to RGB
    rgb = ind2rgb(ind,full_map);
  end %im2rgb

image(rgb), axis image
%subimage(im,full_map)
axis off, title('Input Image')

%top right - segmented (eventually)
h_ax2 = axes('unit','norm','pos',[0.55 0.35 0.4 0.60]);
axis off
setappdata(h_fig,'h_ax2',h_ax2)

%next to bottom - intensity distribution
h_hist = axes('unit','norm','pos',[0.05 0.1 0.9 0.2]);
n = hist(double(im(:)),bin_ctrs);
bar(bin_ctrs,n)
axis([color_range limits(n(2:end-1))]) %ignore saturated end scaling
set(h_hist,'xtick',[],'ytick',[])
title('Intensity Distribution')

%very bottom - colorbar
h_cbar = axes('unit','norm','pos',[0.05 0.05 0.9 0.05],'tag','thresh_tool_cbar');
subimage(color_range,[0.5 1.5],1:num_colors,full_map)
set(h_cbar,'ytick',[],'xlim',color_range)
axis normal

v=version;
if str2num(v(1:3))>=7
  %link top axes (pan & zoom)
  linkaxes([h_ax1 h_ax2])
  %link bottom axes (X only - pan & zoom)
  linkaxes([h_hist h_cbar],'x')
end

%colorbar tick locations
set(h_cbar,'xtick',color_range)

%threshold level - initial guess (graythresh)
if nargin>2 %user specified default level
  my_level = defaultLevel;
else %graythresh default
  lo = double(color_range(1));
  hi = double(color_range(2));
  norm_im = (double(im)-lo)/(hi-lo);
  norm_level = graythresh(norm_im); %GRAYTHRESH assumes DOUBLE range [0,1]
  my_level = norm_level*(hi-lo)+lo;
end

%display level as vertical line
axes(h_hist)
h_lev = vline(my_level,'-');
set(h_lev,'LineWidth',2,'color',0.5*[1 1 1],'UserData',my_level)
setappdata(h_fig,'h_lev',h_lev)

%attach draggable behavior for user to change level
move_vline(h_lev,@update_plot);

axes(h_cbar)
y_lim = get(h_cbar,'ylim');

% PLACE TEXT LOCATION ON COLORBAR (Laurens)
%h_text = text(my_level,mean(y_lim),num2str(round(my_level)));
h_text = text(my_level,mean(y_lim),'dummy','HorizontalAlignment','Center');
if nargin<2
  text_color = 0.5*[1 1 1];
else
  text_color = 'm';
end
set(h_text,'FontWeight','Bold','color',text_color,'Tag','cbar_text')
movex_text(h_text,my_level)
%%%%%%%%%%%%%%%%%%%%%%%%

%segmented image
bw = im>my_level;
axes(h_ax2)
hold on
subimage(bw), axis off, axis ij
hold off
title('Segmented')

update_plot

%add reset button (resort to initial guess)
h_reset = uicontrol('unit','norm','pos',[0.0 0.95 .1 .05]);
set(h_reset,'string','Reset','callback',@ResetOriginalLevel)

if nargout>0 %return result(s)
  h_done = uicontrol('unit','norm','pos',[0.9 0.95 0.1 0.05]);
  set(h_done,'string','Done','callback','delete(gcbo)') %better
  %inspect(h_fig)
  set(h_fig,'WindowStyle','modal')
  waitfor(h_done)
  if ishandle(h_fig)
    h_lev = getappdata(gcf,'h_lev');
    level = mean(get(h_lev,'xdata'));
    if nargout>1
      h_im2 = findobj(h_ax2,'type','image');
      bw = logical(rgb2gray(get(h_im2,'cdata')));
    end
    delete(h_fig)
  else
    warning('THRESHTOOL:UserAborted','User Aborted - no return value')
    level = [];
  end
end

end %thresh_tool (mainfunction)


function ResetOriginalLevel(hObject,varargin) %subfunction
h_lev = getappdata(gcf,'h_lev');
init_level = get(h_lev,'UserData');
set(h_lev,'XData',init_level*[1 1])
text_obj = findobj('Type','Text','Tag','cbar_text');
movex_text(text_obj,init_level)
update_plot
end %ResetOriginalLevel (subfunction)


function update_plot %subfunction
im = getappdata(gcf,'im');
h_lev = getappdata(gcf,'h_lev');
my_level = mean(get(h_lev,'xdata'));
h_ax2 = getappdata(gcf,'h_ax2');
h_im2 = findobj(h_ax2,'type','image');
%segmented image
bw = (im>my_level);
rgb_version = repmat(double(bw),[1 1 3]);
set(h_im2,'cdata',rgb_version)
end %update_plot (subfunction)


%function rgbsubimage(im,map), error('DISABLED')


%----------------------------------------------------------------------
function move_vline(handle,DoneFcn) %subfunction
%MOVE_VLINE implements horizontal movement of line.
%
%  Example:
%    plot(sin(0:0.1:pi))
%    h=vline(1);
%    move_vline(h)
%
%Note: This tools strictly requires MOVEX_TEXT, and isn't much good
%      without VLINE by Brandon Kuczenski, available at MATLAB Central.
%<http://www.mathworks.com/matlabcentral/fileexchange/loadFile.do?objectId=1039&objectType=file>

% This seems to lock the axes position
set(gcf,'Nextplot','Replace')
set(gcf,'DoubleBuffer','on')

h_ax=get(handle,'parent');
h_fig=get(h_ax,'parent');
setappdata(h_fig,'h_vline',handle)
if nargin<2, DoneFcn=[]; end
setappdata(h_fig,'DoneFcn',DoneFcn)
set(handle,'ButtonDownFcn',@DownFcn)

  function DownFcn(hObject,eventdata,varargin) %Nested--%
    set(gcf,'WindowButtonMotionFcn',@MoveFcn)           %
    set(gcf,'WindowButtonUpFcn',@UpFcn)                 %
  end %DownFcn------------------------------------------%

  function UpFcn(hObject,eventdata,varargin) %Nested----%
    set(gcf,'WindowButtonMotionFcn',[])                 %
    DoneFcn=getappdata(hObject,'DoneFcn');              %
    if isstr(DoneFcn)                                   %
      eval(DoneFcn)                                     %
    elseif isa(DoneFcn,'function_handle')               %
      feval(DoneFcn)                                    %
    end                                                 %
  end %UpFcn--------------------------------------------%

  function MoveFcn(hObject,eventdata,varargin) %Nested------%
    h_vline=getappdata(hObject,'h_vline');                  %
    h_ax=get(h_vline,'parent');                             %
    cp = get(h_ax,'CurrentPoint');                          %
    xpos = cp(1);                                           %
    x_range=get(h_ax,'xlim');                               %
    if xpos<x_range(1), xpos=x_range(1); end                %
    if xpos>x_range(2), xpos=x_range(2); end                %
    XData = get(h_vline,'XData');                           %
    XData(:)=xpos;                                          %
    set(h_vline,'xdata',XData)                              %
    %update text                                            %
    text_obj = findobj('Type','Text','Tag','cbar_text');    %
    movex_text(text_obj,xpos)                               %
  end %MoveFcn----------------------------------------------%

end %move_vline(subfunction)


%----------------------------------------------------------------------
function [x,y] = limits(a) %subfunction
% LIMITS returns min & max values of matrix; else scalar value.
%
%   [lo,hi]=LIMITS(a) returns LOw and HIgh values respectively.
%
%   lim=LIMITS(a) returns 1x2 result, where lim = [lo hi] values

if nargin~=1 | nargout>2 %bogus syntax
  error('usage: [lo,hi]=limits(a)')
end

siz=size(a);

if prod(siz)==1 %scalar
  result=a;                         % value
else %matrix
  result=[min(a(:)) max(a(:))];     % limits
end

if nargout==1 %composite result
  x=result;                         % 1x2 vector
elseif nargout==2 %separate results
  x=result(1);                      % two scalars
  y=result(2);
else %no result
  ans=result                        % display answer
end

end %limits (subfunction)


%----------------------------------------------------------------------
function movex_text(h_txt,x_pos) %subfunction
FmtSpec=getappdata(get(get(h_txt,'parent'),'parent'),'FmtSpec');
msg=sprintf(FmtSpec,x_pos);
pos=get(h_txt,'position');
pos(1)=x_pos;
set(h_txt,'Position',pos,'String',msg)
end %movex_text


%--------------------------------------------------------------------------------------------------------------
function hhh=vline(x,in1,in2) %subfunction
% function h=vline(x, linetype, label)
%
% Draws a vertical line on the current axes at the location specified by 'x'.  Optional arguments are
% 'linetype' (default is 'r:') and 'label', which applies a text label to the graph near the line.  The
% label appears in the same color as the line.
%
% The line is held on the current axes, and after plotting the line, the function returns the axes to
% its prior hold state.
%
% The HandleVisibility property of the line object is set to "off", so not only does it not appear on
% legends, but it is not findable by using findobj.  Specifying an output argument causes the function to
% return a handle to the line, so it can be manipulated or deleted.  Also, the HandleVisibility can be
% overridden by setting the root's ShowHiddenHandles property to on.
%
% h = vline(42,'g','The Answer')
%
% returns a handle to a green vertical line on the current axes at x=42, and creates a text object on
% the current axes, close to the line, which reads "The Answer".
%
% vline also supports vector inputs to draw multiple lines at once.  For example,
%
% vline([4 8 12],{'g','r','b'},{'l1','lab2','LABELC'})
%
% draws three lines with the appropriate labels and colors.
%
% By Brandon Kuczenski for Kensington Labs.
% brandon_kuczenski@kensingtonlabs.com
% 8 November 2001

% Downloaded 8/7/03 from MATLAB Central
% http://www.mathworks.com/matlabcentral/fileexchange/loadFile.do?objectId=1039&objectType=file

if length(x)>1  % vector input
    for I=1:length(x)
        switch nargin
        case 1
            linetype='r:';
            label='';
        case 2
            if ~iscell(in1)
                in1={in1};
            end
            if I>length(in1)
                linetype=in1{end};
            else
                linetype=in1{I};
            end
            label='';
        case 3
            if ~iscell(in1)
                in1={in1};
            end
            if ~iscell(in2)
                in2={in2};
            end
            if I>length(in1)
                linetype=in1{end};
            else
                linetype=in1{I};
            end
            if I>length(in2)
                label=in2{end};
            else
                label=in2{I};
            end
        end
        h(I)=vline(x(I),linetype,label);
    end
else
    switch nargin
    case 1
        linetype='r:';
        label='';
    case 2
        linetype=in1;
        label='';
    case 3
        linetype=in1;
        label=in2;
    end


    g=ishold(gca);
    hold on

    y=get(gca,'ylim');
    h=plot([x x],y,linetype);
    if length(label)
        xx=get(gca,'xlim');
        xrange=xx(2)-xx(1);
        xunit=(x-xx(1))/xrange;
        if xunit<0.8
            text(x+0.01*xrange,y(1)+0.1*(y(2)-y(1)),label,'color',get(h,'color'))
        else
            text(x-.05*xrange,y(1)+0.1*(y(2)-y(1)),label,'color',get(h,'color'))
        end
    end

    if g==0
    hold off
    end
    set(h,'tag','vline','handlevisibility','off')
end % else

if nargout
    hhh=h;
end

end %vline (subfunction)

 浙公网安备 33010602011771号