

alertmanager安装部署+钉钉告警
我这里安装与prometheus,grafana同一台服务器上(192.168.1.136)
1.下载安装介质
cd /soft/
wget https://github.com/prometheus/alertmanager/releases/download/v0.28.1/alertmanager-0.28.1.linux-amd64.tar.gz
2.解压安装
cd /soft
tar -xvf alertmanager-0.28.1.linux-amd64.tar.gz
mv alertmanager-0.28.1.linux-amd64 /opt/alertmanager
3.创建数据存放目录
mkdir -p /opt/alertmanager/data
4.做成系统服务
#让systemctl管理起来
[root@basepub-tools ~]# cat /etc/systemd/system/alertmanager.service
[Unit]
Description=alertmanager
After=network.target
[Service]
Type=simple
User=root
ExecStart=/opt/alertmanager/alertmanager --config.file=/opt/alertmanager/alertmanager.yml  --storage.path=/opt/alertmanager/data/ $OPTIONS
ExecReload=/bin/kill -HUP $MAINPID
Restart=on-failure
[Install]
WantedBy=multi-user.target
5.启动alertmanager
[root@basepub-tools ~]# systemctl daemon-reload
[root@basepub-tools ~]# systemctl start alertmanager
[root@basepub-tools ~]# systemctl status alertmanager
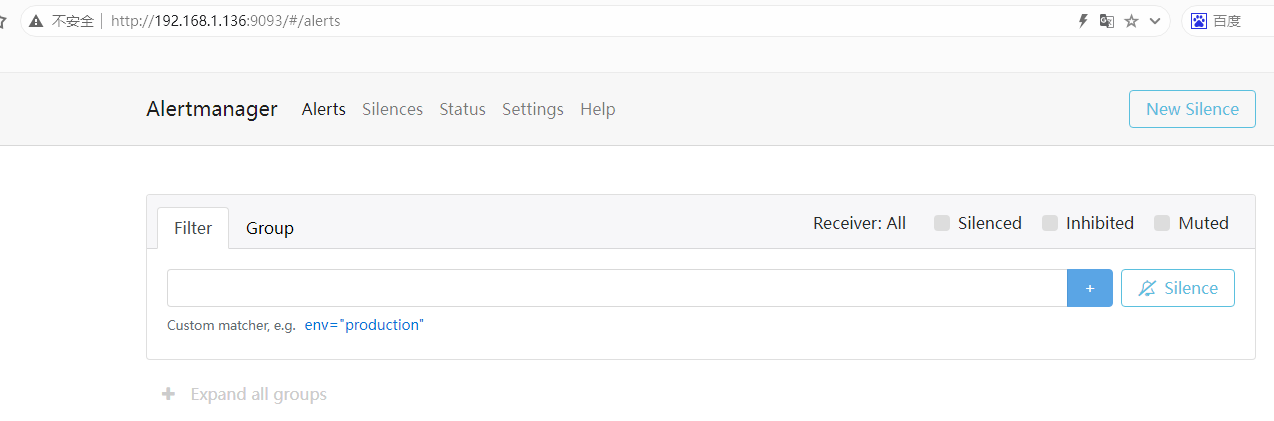
6.访问alertmanager界面
http://主机:9093
http://192.168.1.136:9093
7.alertmanager配置文件
默认的alertmanager.yml配置文件,内容如下所示:
[root@localhost alertmanager]# more alertmanager.yml
route:
  group_by: ['alertname']
  group_wait: 30s
  group_interval: 5m
  repeat_interval: 1h
  receiver: 'web.hook'
receivers:
  - name: 'web.hook'
    webhook_configs:
      - url: 'http://127.0.0.1:5001/'
inhibit_rules:
  - source_match:
      severity: 'critical'
    target_match:
      severity: 'warning'
    equal: ['alertname', 'dev', 'instance']
8.关联Prometheus与Alertmanager
修改prometheus的配置文件
vi /opt/prometheus/conf/prometheus.yml
# Alertmanager configuration
alerting:
  alertmanagers:
    - static_configs:
        - targets:
           - 192.168.1.136:9093
检查配置文件是否正确
[root@localhost bin]# /opt/prometheus/bin/promtool check config /opt/prometheus/conf/prometheus.yml
Checking /opt/prometheus/conf/prometheus.yml
SUCCESS: /opt/prometheus/conf/prometheus.yml is valid prometheus config file syntax
重新启动 prometheus
[root@localhost bin]# systemctl stop prometheus.service
[root@localhost bin]# systemctl start prometheus.service
9.新增prometheus规则
vim /opt/prometheus/rules/node.yml
groups:
# 报警组组名称
- name: alters
  #报警组规则
  rules:
   #告警名称,需唯一
  - alert: cpu使用率大于75%
    #promQL表达式
    expr: sum(avg without (cpu)(irate(node_cpu_seconds_total{mode!='idle'}[5m]))) by (instance) > 0.75
    #满足此表达式持续时间超过for规定的时间才会触发此报警
    for: 1m
    labels:
      #严重级别
      severity: warning
    annotations:
     #发出的告警标题
      summary: "实例 {{ $labels.instance }} CPU 使用率过高"
      #发出的告警内容
      description: "实例{{ $labels.instance }} CPU 使用率超过 75% (当前值为: {{ $value }})"
  - alert: 内存使用率大于90%
    expr: (node_memory_MemTotal_bytes - node_memory_MemAvailable_bytes)/node_memory_MemTotal_bytes > 0.90
    for: 1m
    labels:
      severity: warning
    annotations:
      summary: "实例 {{ $labels.instance }} 内存使用率过高"
      description: "实例 {{ $labels.instance }} 内存使用率 90% (当前值为: {{ $value }})"
vim /opt/prometheus/rules/node_alters.yml
groups:
- name: Alerthost
  rules:
  - alert: 服务器宕机
    expr: avg by (instance) (up{job="host"}) == 0
    for: 15s       #控制在触发告警之前,测试表达式的值必须为true的时长
    labels:
      severity: '突发事件'
    annotations:
      description: "实例 {{ $labels.instance }} 服务器已宕机,请进行检查."
      summary: "{{ $labels.instance }} 机器已经宕机超过15秒"
  - alert: 磁盘使用率大于80%
    expr: 100 - (node_filesystem_free_bytes{mountpoint="/",fstype=~"ext4|xfs"} / node_filesystem_size_bytes{fstype=~"ext4|xfs"} * 100) > 80
    for: 2m
    labels:
      severity: warning
    annotations:
      description: "{{ $labels.instance  }} : {{ $labels.job  }} :{{ $labels.mountpoint  }} 这个分区使用大于百分之80% (当前值:{{ $value }})"
      summary: "Instance {{ $labels.instance  }} :{{ $labels.mountpoint }} 分区使用率过高"
10.重启prometheus
systemctl restart prometheus.service
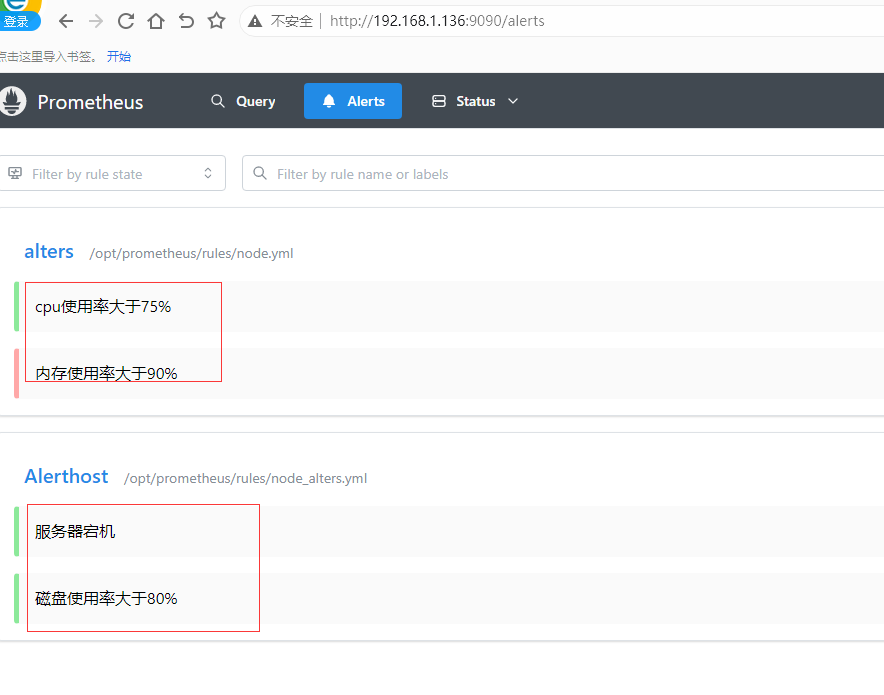
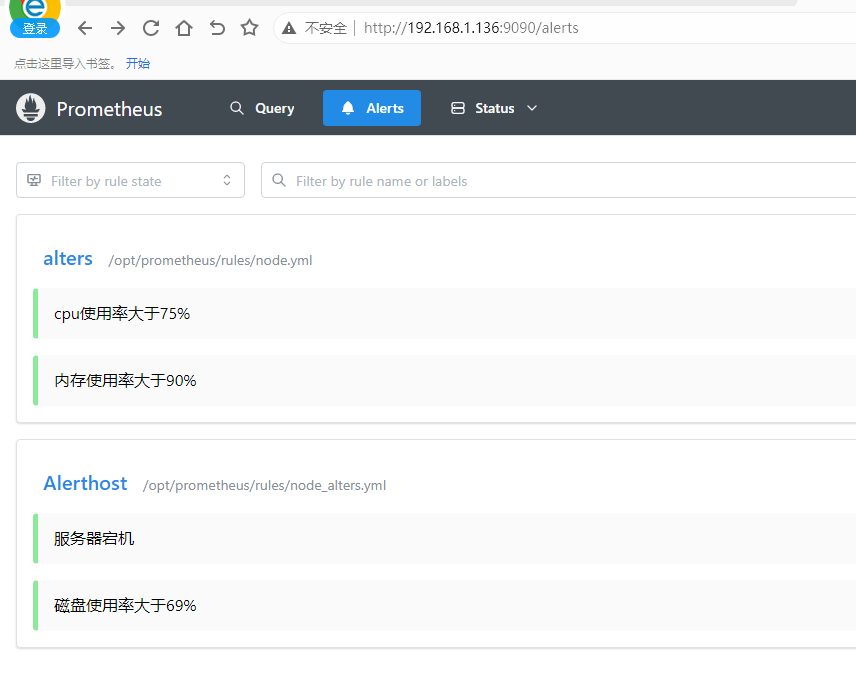
11.访问prometheus页面,看是否添加成功
http://192.168.1.136:9090/
#####################################安装钉钉告警插件###################################
1.安装钉钉告警插件
我这里插件安装在prometheus服务器同一台机器上
[root@localhost soft]#cd /soft/
[root@localhost soft]#wget https://github.com/timonwong/prometheus-webhook-dingtalk/releases/download/v2.1.0/prometheus-webhook-dingtalk-2.1.0.linux-amd64.tar.gz
[root@localhost soft]#tar -xvf prometheus-webhook-dingtalk-2.1.0.linux-amd64.tar.gz
[root@localhost soft]#mv prometheus-webhook-dingtalk-2.1.0.linux-amd64 /opt/prometheus-webhook-dingtalk
2.配置prometheus-webhook-dingtalk
[root@localhost prometheus-webhook-dingtalk]# more config.yml
## Request timeout
# timeout: 5s

## Uncomment following line in order to write template from scratch (be careful!)
#no_builtin_template: true

## Customizable templates path
templates:
  - /opt/prometheus-webhook-dingtalk/contrib/templates/legacy/template.tmpl

## You can also override default template using `default_message`
## The following example to use the 'legacy' template from v0.3.0
##default_message:
##  title: '{{ template "legacy.title" . }}'
##  text: '{{ template "legacy.content" . }}'

## Targets, previously was known as "profiles"
targets:
  webhook_legacy:
    url: https://oapi.dingtalk.com/robot/send?access_token=3aefdd30d08adaf4f2de06aa04fd39139c642054769643a36b2112fc278aaaa
说明:
a.我这里模版使用系统自带的模版
b.钉钉群告警里设置了关键字"告警"2个字,告警模版内容也必须包含"告警'2个字,这个根据个人情况设置
查看告警模版内如
[root@localhost prometheus-webhook-dingtalk]# more /opt/prometheus-webhook-dingtalk/contrib/templates/legacy/template.tmpl
{{ define "__subject" }}
[{{ .Status | toUpper }}{{ if eq .Status "firing" }}:{{ .Alerts.Firing | len }}{{ end }}]
{{ end }}


{{ define "__alert_list" }}{{ range . }}
---
{{ if .Labels.owner }}@{{ .Labels.owner }}{{ end }}

**告警主题**: {{ .Annotations.summary }}

**告警类型**: {{ .Labels.alertname }}

**告警级别**: {{ .Labels.severity }}

**告警主机**: {{ .Labels.instance }}

**告警信息**: {{ index .Annotations "description" }}

**告警时间**: {{ dateInZone "2006.01.02 15:04:05" (.StartsAt) "Asia/Shanghai" }}
{{ end }}{{ end }}

{{ define "__resolved_list" }}{{ range . }}
---
{{ if .Labels.owner }}@{{ .Labels.owner }}{{ end }}

**告警主题**: {{ .Annotations.summary }}

**告警类型**: {{ .Labels.alertname }}

**告警级别**: {{ .Labels.severity }}

**告警主机**: {{ .Labels.instance }}

**告警信息**: {{ index .Annotations "description" }}

**告警时间**: {{ dateInZone "2006.01.02 15:04:05" (.StartsAt) "Asia/Shanghai" }}

**恢复时间**: {{ dateInZone "2006.01.02 15:04:05" (.EndsAt) "Asia/Shanghai" }}
{{ end }}{{ end }}


{{ define "default.title" }}
{{ template "__subject" . }}
{{ end }}

{{ define "default.content" }}
{{ if gt (len .Alerts.Firing) 0 }}
**====侦测到{{ .Alerts.Firing | len  }}个故障====**
{{ template "__alert_list" .Alerts.Firing }}
---
{{ end }}

{{ if gt (len .Alerts.Resolved) 0 }}
**====恢复{{ .Alerts.Resolved | len  }}个故障====**
{{ template "__resolved_list" .Alerts.Resolved }}
{{ end }}
{{ end }}


{{ define "ding.link.title" }}{{ template "default.title" . }}{{ end }}
{{ define "ding.link.content" }}{{ template "default.content" . }}{{ end }}
{{ template "default.title" . }}
{{ template "default.content" . }}
3.启动钉钉告警插件
[root@localhost prometheus-webhook-dingtalk]# cd /opt/prometheus-webhook-dingtalk
[root@localhost prometheus-webhook-dingtalk]#nohup ./prometheus-webhook-dingtalk --config.file=config.yml > webhook.log 2>&1 &
4.检查插件是否正常运行
[root@localhost prometheus-webhook-dingtalk]#ps aux | grep prometheus-webhook-dingtalk
[root@localhost prometheus-webhook-dingtalk]# ps aux | grep prometheus-webhook-dingtalk
root     30117  0.0  0.0 717416  5912 pts/2    Sl   14:39   0:00 ./prometheus-webhook-dingtalk --config.file=config.yml
查看日志输出
ts=2025-04-25T02:39:41.183Z caller=main.go:59 level=info msg="Starting prometheus-webhook-dingtalk" version="(version=2.1.0, branch=HEAD, revision=8580d1395f59490682fb2798136266bdb3005ab4)"
ts=2025-04-25T02:39:41.183Z caller=main.go:60 level=info msg="Build context" (gogo1.18.1,userroot@177bd003ba4d,date20220421-08:19:05)=(MISSING)
ts=2025-04-25T02:39:41.183Z caller=coordinator.go:83 level=info component=configuration file=config.yml msg="Loading configuration file"
ts=2025-04-25T02:39:41.209Z caller=coordinator.go:91 level=info component=configuration file=config.yml msg="Completed loading of configuration file"
ts=2025-04-25T02:39:41.209Z caller=main.go:97 level=info component=configuration msg="Loading templates" templates=/opt/prometheus-webhook-dingtalk/contrib/templates/legacy/template.tmpl
ts=2025-04-25T02:39:41.211Z caller=main.go:113 component=configuration msg="Webhook urls for prometheus alertmanager" urls=http://localhost:8060/dingtalk/webhook_legacy/send
ts=2025-04-25T02:39:41.211Z caller=web.go:208 level=info component=web msg="Start listening for connections" address=:8060
日志里输出的url是需要在alertmanager配置的地址
urls=http://localhost:8060/dingtalk/webhook_legacy/send
5.修改alertmanager配置文件
vi /opt/alertmanager/alertmanager.yml
把日志里面的钉钉webhook地址添加进来
[root@localhost rules]# more /opt/alertmanager/alertmanager.yml
route:
  group_by: ['alertname']
  group_wait: 30s
  group_interval: 5m
  repeat_interval: 1h
  receiver: 'dingding'
receivers:
  - name: 'dingding'
    webhook_configs:
      - url: 'http://localhost:8060/dingtalk/webhook_legacy/send'
        send_resolved: true
inhibit_rules:
  - source_match:
      severity: 'critical'
    target_match:
      severity: 'warning'
    equal: ['alertname', 'dev', 'instance']
6.重启 alertmanager
systemctl stop alertmanager
systemctl start alertmanager
7.验证
模拟生产一个大文件,使磁盘使用空间超过阀值
cd /tmp/
dd if=/dev/zero of=test bs=1M count=6000
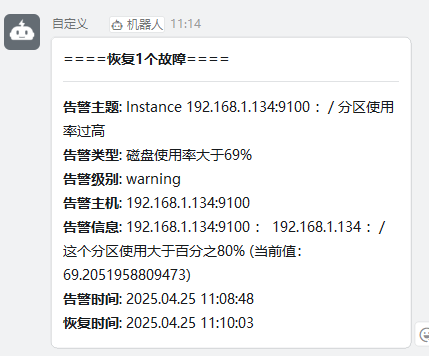
会输出如下的告警

然后删除大文件,会收到恢复后的提示
8.在prometheus页面也可以看得到相应的告警信息

 浙公网安备 33010602011771号