ELK收集nginx访问日志实战案例
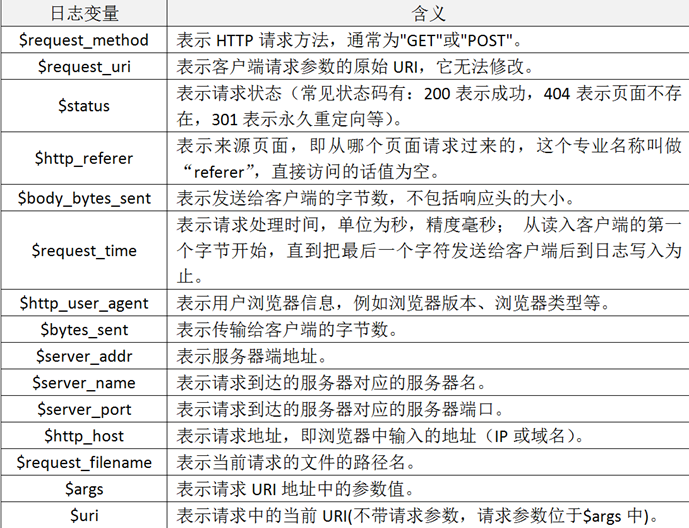
一、Nginx的日志格式和日志变量
Nginx跟Apache一样,都支持自定义输出日志格式,在进行Nginx日志格式定义前,先来了解一下关于多层代理获取用户真实IP的几个概念。
remote_addr:表示客户端地址,但有个条件,如果没有使用代理,这个地址就是客户端的真实IP,如果使用了代理,这个地址就是上层代理的IP。
X-Forwarded-For:简称XFF,这是一个HTTP扩展头,格式为 X-Forwarded-For: client, proxy1, proxy2,如果一个HTTP请求到达服务器之前,经过了三个代理 Proxy1、Proxy2、Proxy3,IP 分别为 IP1、IP2、IP3,用户真实IP为 IP0,那么按照 XFF标准,服务端最终会收到以下信息:
X-Forwarded-For: IP0, IP1, IP2
由此可知,IP3这个地址X-Forwarded-For并没有获取到,而remote_addr刚好获取的就是IP3的地址。
还要几个容易混淆的变量,这里也列出来做下说明:
$remote_addr:此变量如果走代理访问,那么将获取上层代理的IP,如果不走代理,那么就是客户端真实IP地址。
$http_x_forwarded_for:此变量获取的就是X-Forwarded-For的值。
$proxy_add_x_forwarded_for:此变量是$http_x_forwarded_for和$remote_addr两个变量之和。
二、自定义Nginx日志格式
在掌握了Nginx日志变量的含义后,接着开始对它输出的日志格式进行改造,这里我们仍将Nginx日志输出设置为json格式,下面仅列出Nginx配置文件nginx.conf中日志格式和日志文件定义部分,定义好的日志格式与日志文件如下:
map $http_x_forwarded_for $clientRealIp {
"" $remote_addr;
~^(?P<firstAddr>[0-9\.]+),?.*$ $firstAddr;
}
log_format nginx_log_json '{"accessip_list":"$proxy_add_x_forwarded_for","client_ip":"$clientRealIp","http_host":"$host","@timestamp":"$time_iso8601","method":"$request_method","url":"$request_uri","status":"$status","http_referer":"$http_referer","body_bytes_sent":"$body_bytes_sent","request_time":"$request_time","http_user_agent":"$http_user_agent","total_bytes_sent":"$bytes_sent","server_ip":"$server_addr"}';
access_log /u01/nginx/logs/access.log nginx_log_json;
定义完nginx日志格式后,重启nginx服务。
三、配置filebeat采集nginx日志
**************************************************************************************
filebeat.inputs:
- type: log
enabled: true
paths:
- /u01/nginx/logs/access.log
- type: filestream
enabled: false
paths:
- /var/log/*.log
fields:
service: zabbixnginx
filebeat.config.modules:
path: ${path.config}/modules.d/*.yml
reload.enabled: false
setup.template.settings:
index.number_of_shards: 1
setup.kibana:
output.kafka:
hosts: ["10.210.xx.xx:9200","10.210.xx.xx:9200","10.210.xx.xx:9200"]
topic: zabnginxlog
**************************************************************************************
四、配置logstash
input {
        kafka
        {
          bootstrap_servers => "10.210.xx.82:9092,10.210.xx.128:9092,10.210.xx.159:9092"
          topics => ["linuxoslog"]
          codec => "json"
          type => "linuxlog"
        }

        kafka
        {
           bootstrap_servers => "10.210.xx.82:9092,10.210.xx.128:9092,10.210.xx.159:9092"
           topics => ["zabnginxlog"]
           codec => json
           {
              charset => "UTF-8"
           }
           type => "zabnginxlog"
           add_field => {"[@metadata][myid]" => "nginxaccess-log" }
        }

        kafka
        {
           bootstrap_servers => "10.210.xx.xx:9092,10.210.xx.128:9092,10.210.xx.159:9092"
           topics => ["winoslog"]
           codec => "json"
           type => "winlog"
        }

}

filter{
   if [@metadata][myid] == "nginxaccess-log"
   {
       mutate
       {
         gsub => ["message", "\\x", "\\\x"]
       }
       if ('method":"HEAD' in [message] )
       {
         drop {}
       }
       json
       {
         source => "message"
         remove_field => "prospector"
         remove_field => "beat"
         remove_field => "source"
         remove_field => "agent"
         remove_field => "input"
         remove_field => "offset"
         remove_field => "fields"
         remove_field => "host"
         remove_field => "@version"
         remove_field => "message"
       }
   }
}

output {
    if [type] == "linuxlog" {
         elasticsearch {
            hosts => ["10.210.xx.xx:9200","10.210.xx.xx:9200","10.210.xx.xx:9200"]
            user => 'elastic'
            password => 'elk2021'
            index => "linuxoslog-%{+YYYY-MM-dd}"
         }
     }

     if [type] == "winlog" {
         elasticsearch {
            hosts => ["10.210.xx.xx:9200","10.210.xx.xx:9200","10.210.xx.xx:9200"]
            user => 'elastic'
            password => 'elk2021'
            index => "winoslog-%{+YYYY-MM-dd}"
         }
     }

     if [@metadata][myid] == "nginxaccess-log"
     {
       elasticsearch
       {
          hosts => ["10.210.xx.xx:9200","10.210.xx.xx:9200","10.210.xx.xx:9200"]
          user => 'elastic'
          password => 'elk2021'
          index => "zabnginxlog-%{+YYYY-MM-dd}"
       }
     }
}
五、配置kibana
Filebeat从nginx上收集数据到kafka,然后logstash从kafka拉取数据,如果数据能够正确发送到elasticsearch,我们就可以在Kibana中配置索引了。

 浙公网安备 33010602011771号