

echart图表--雷达图表的动态数据max
使用vue+echart图表。
引入echart
npm i echart
可参考:https://www.npmjs.com/package/echart(npm官网)
在main.js中引入,挂载在vue实例上。
import * as echarts from 'echarts';
Vue.prototype.$echarts=echarts;
在LeiDa.vue文件中配置如下
<template>
  <div>
    <div style="width: 500px; height: 500px" ref="chart" id="chart"></div>
  </div>
</template>
<script>
export default {
  data() {
    return {};
  },
  methods: {
    initCharts() {
      let bookCategoryChart = this.$echarts.init(
        document.getElementById("chart")
      );
      var color = ["#f43f4d", "#fe9100", "#03b38c", "#009afe"];
      var Data = [
        {
          value: 85,
          name: "特征值",
        },
        {
          value: 660,
          name: "特征值",
        },
        {
          value: 57,
          name: "特征值",
        },
        {
          value: 50,
          name: "特征值4",
        },
        {
          value: 60,
          name: "特征值5",
        },
      ];
    let may=Data.map(item=>{
        return item.value;
    })
     let maxx = Math.max(...may)+'';
     maxx=maxx.split('')
     console.log(maxx);
    let double=(Number(maxx[0])+1) //向上取+1
    let big=(double+(double%2))*(Math.pow(10,(maxx.length-1)))  //判断是否为2的倍数,若是则取余加余数。
    console.log(big);
    // console.log(may);
      var value = [];
      var name = [];
      var indicator = [];
      var radarData = [];
      var scatterData = [];
      Data.map(function (e, i) {
        value.push(e.value);
        name.push(e.name);
        var cor = color[0];
        indicator.push({
          text: e.name,
          max: big,
          color: cor,
        });
        scatterData.push({
          value: [e.value, i],
          itemStyle: {
            normal: {
              color: cor,
              borderColor: cor,
              borderWidth: 2,
            },
          },
        });
      });
      radarData.push({ value: value });
      var option = {
        backgroundColor: "#33333C",
        tooltip: {
          trigger: "axis",
        },
        radar: [
          {
            indicator: indicator,
            name: {
              show: true,
              textStyle: {
                fontWeight: "bold",
                fontSize: 14,
              },
            },

            center: ["50%", "50%"],
            radius: "80%",
            shape: "circle",
            axisLine: {
              lineStyle: {
                color: "rgba(255,255,255,0.3)",
              },
            },
            axisTick: {
              show: false,
              lineStyle: {
                color: "rgba(255,255,255,0.3)",
              },
            },
            splitArea: {
              show: true,
              areaStyle: {
                color: ["transparent"],
              },
            },
            splitLine: {
              show: true,
              lineStyle: {
                width: 1,
                color: "rgba(255,255,255,0.3)",
              },
            },
          },
        ],
        polar: {},
        angleAxis: {
          type: "category",
          data: name,
          boundaryGap: false,
          clockwise: false,
          axisTick: {
            show: false,
          },
          axisLabel: {
            show: false,
          },
          axisLine: {
            show: false,
          },
          splitLine: {
            show: false,
          },
        },
        radiusAxis: {
          min: 0,
          max: big,

          splitLine: {
            show: false,
          },
          axisTick: {
            show: false,
          },
          axisLabel: {
            color: "#bfbfbe",
          },
        },
        series: [
          {
            name: "",
            type: "radar",
            tooltip: {
              trigger: "item",
            },

            symbolSize: 6,
            itemStyle: {
              normal: {
                color: "#fff",
                borderColor: "#009afe",
                borderWidth: 2,
              },
            },
            lineStyle: {
              color: "#ff9100",
              width: 2,
            },
            areaStyle: {
              opacity: 1,
              color: this.$echarts.graphic.LinearGradient(
                0,
                0,
                1,
                0,
                [
                  {
                    offset: 1,
                    color: "rgba(0, 154, 254, 0.6)",
                  },
                  {
                    offset: 0,
                    color: "rgba(84, 114, 211, 0.6)",
                  },
                ],
                false
              ),
              type: "default",
            },
            data: radarData,
          },
          {
            name: "",
            type: "scatter",
            coordinateSystem: "polar",
            symbolSize: 10,
            data: scatterData,
          },
        ],
      };
      bookCategoryChart.setOption(option);
    },
  },
  mounted() {
    this.initCharts();
  },
};
</script>
max参数参考:https://echarts.apache.org/zh/option.html#radar.indicator.max
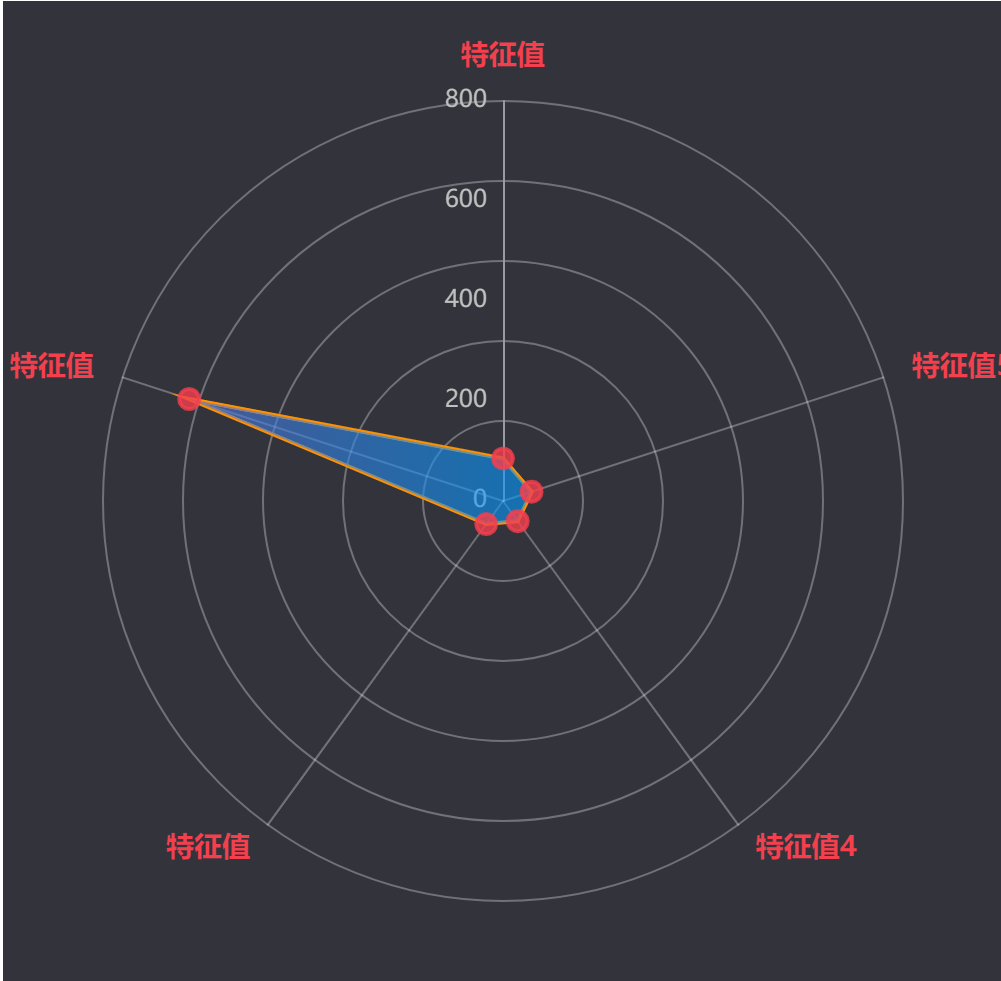
效果如图:
集思广益,仅供学习,侵权即删!!

 浙公网安备 33010602011771号