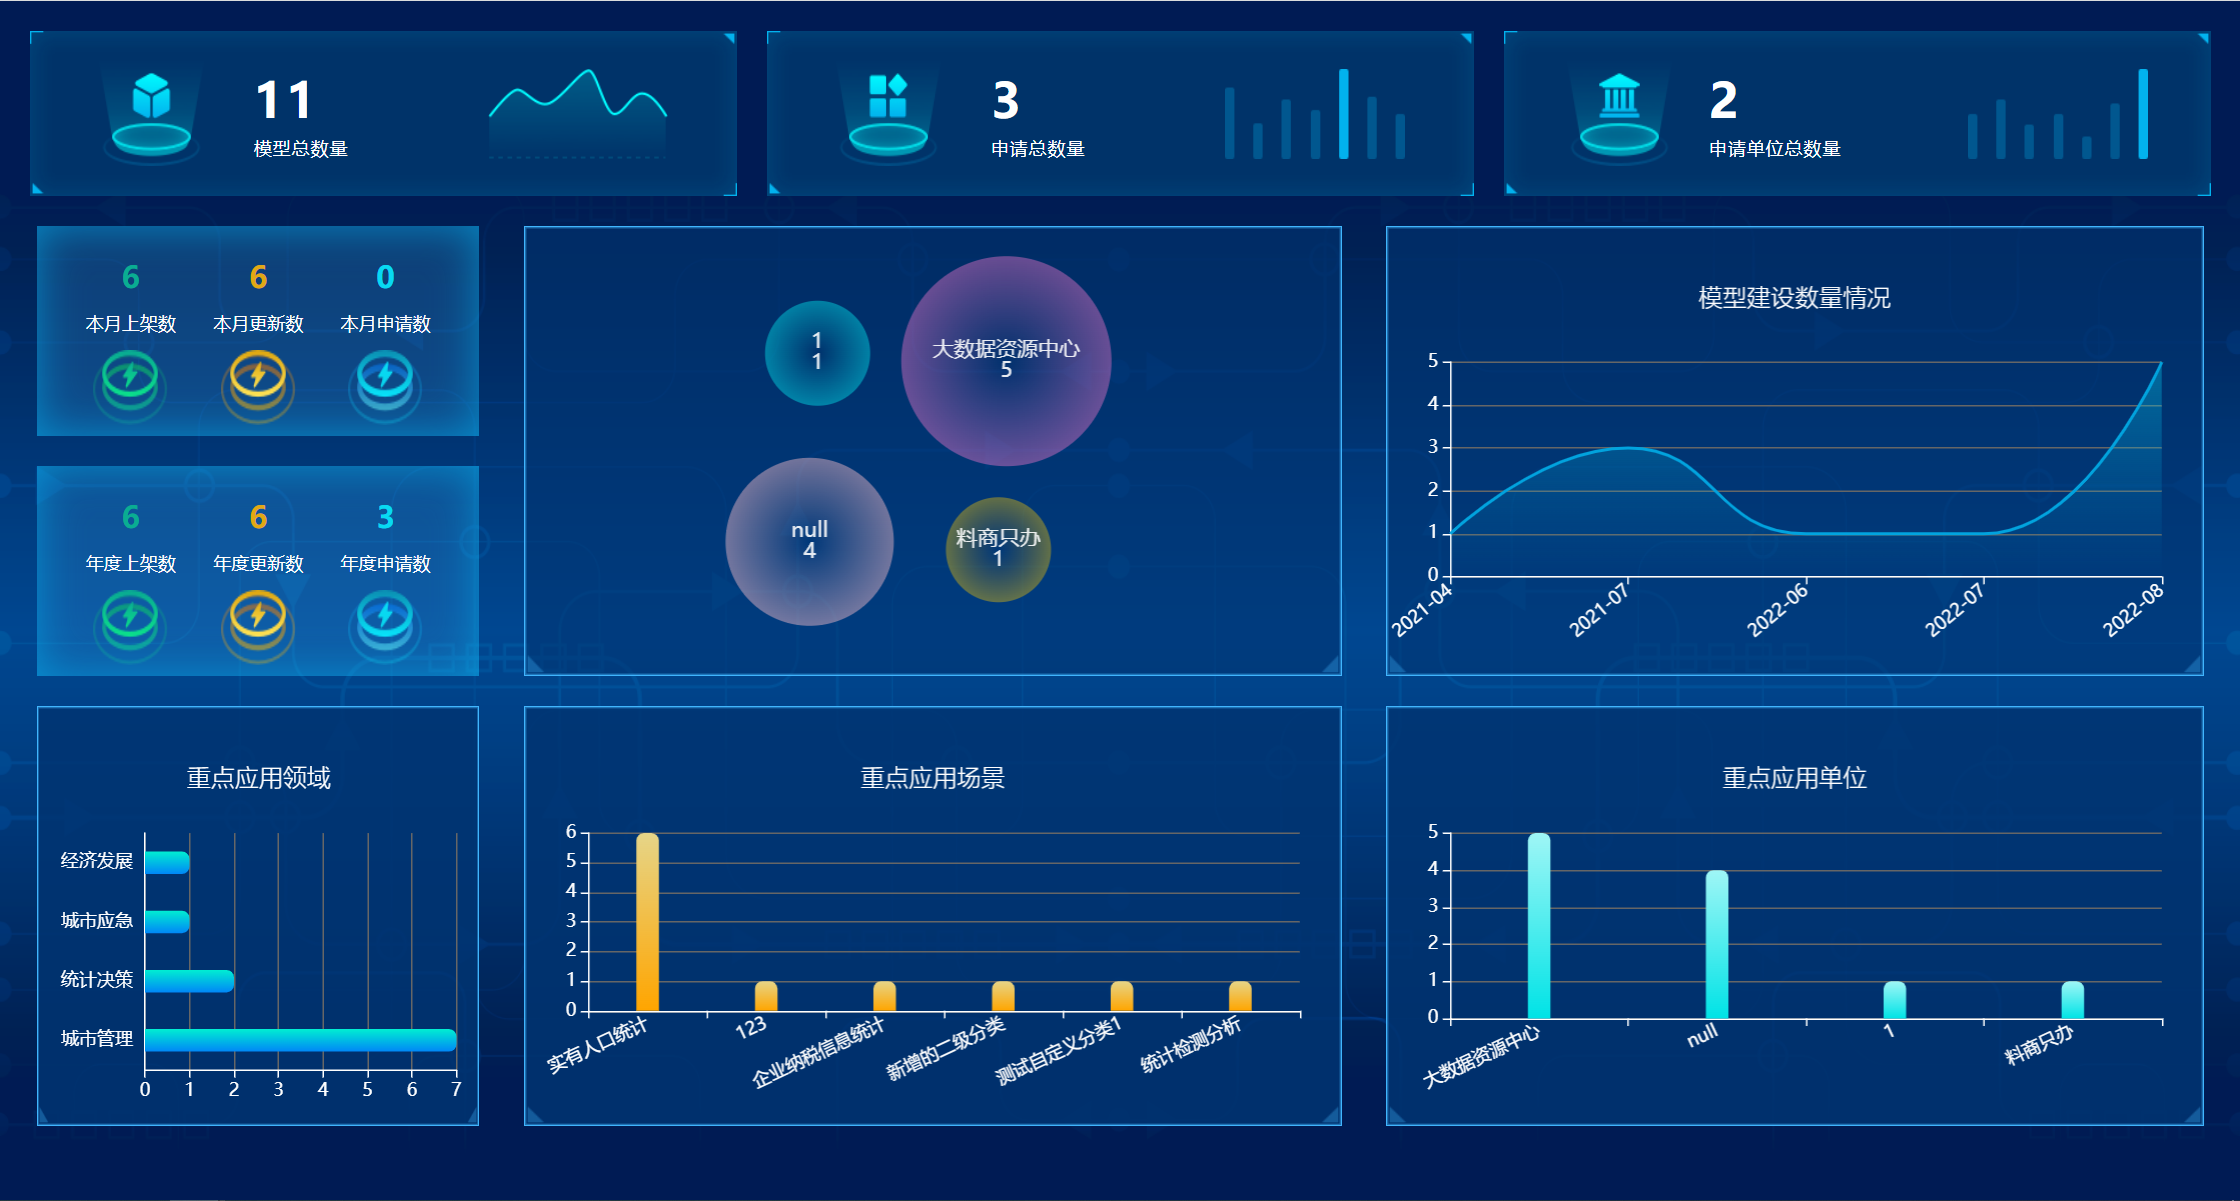
vue3 - 封装图表组件

把相同或者类似的图表进行封装
父组件使用:
<Report
        :info="main4"
        :xdata="RXData4"
        :sdata="RSData4"
        :title="title4"
        :color="color4"
        :barBorderRadius="barBorderRadius4"
        class="div"
      ></Report>
引入组件
import Report from "@/components/Report/index";
定义变量
const data = reactive({
  RXData4: [],
  RSData4: [],
});
const title4 = ref("重点应用单位");
const color4 = ref(["#9FF6F6", "#00E3E6"]);
const barBorderRadius4 = ref([5, 5, 0, 0]);
const main4 = ref("main4");
const {
  RXData4,
  RSData4,
} = toRefs(data);
然后自己从接口里面取数据给RXData4和RSData4填充数据
ps:我页面组件使用了setup语法糖
子组件:
<template>
  <div :id="info"></div>
</template>

<script setup>
import * as echarts from "echarts";
const props = defineProps({
  info: String, //dom的id
  title: String,
  xdata: {
    type: Array,
    default: [],
  },
  sdata: {
    type: Array,
    default: [],
  },
  barBorderRadius: {
    type: Array,
    default: [],
  },
  color: {
    type: Array,
    default: [],
  },
});

const { info, title, xdata, sdata, barBorderRadius, color } = toRefs(props);

watch(
  sdata,
  (newData, oldData) => {
    nextTick(() => {
      initReport();
    });
  },
  { immediate: true, deep: true }
);
function initReport() {
  const myChart = echarts.init(document.getElementById(info.value));
  const option = {
    title: {
      text: title.value,
      left: "center",
      padding: [40, 10],
      textStyle: {
        color: "#fff",
        fontWeight: "lighter",
        fontSize: 16,
      },
    },
    tooltip: {
      trigger: "axis", //控制鼠标移入是否有提示信息
      axisPointer: {
        type: "line",
      },
    },
    grid: {
      top: "30%",
      left: "5%",
      right: "5%",
      bottom: "6%",
      containLabel: true,
    },
    xAxis: {
      type: "category",
      axisTick: {
        show: true,
      },
      splitLine: {
        lineStyle: {
          color: "#666",
        },
      },
      axisLabel: {
        interval: 0,
        rotate: 25,
      },
      axisLine: {
        show: true,
        lineStyle: {
          color: "#fff",
        },
      },
      data: xdata.value,
    },
    yAxis: {
      type: "value",
      axisTick: {
        show: true,
      },
      splitLine: {
        lineStyle: {
          color: "#666",
        },
      },
      axisLine: {
        show: true,
        lineStyle: {
          color: "#fff",
        },
      },
    },
    series: [
      {
        data: sdata.value,
        type: "bar",
        barWidth: 15,
        itemStyle: {
          normal: {
            // barBorderRadius: [5, 5, 0, 0],
            barBorderRadius: barBorderRadius.value,
            color: new echarts.graphic.LinearGradient(0, 0, 0, 1, [
              {
                offset: 0,
                color: color.value[0], // 0% 处的颜色
              },
              {
                offset: 1,
                color: color.value[1], // 100% 处的颜色
              },
            ]),
          },
        },
      },
    ],
  };
  myChart.setOption(option);
  window.addEventListener("resize", () => {
    myChart.resize();
  });
}
</script>
<style>
</style>
ps:需要注意同步异步取数据的问题,我这边用的是在子组件用watch监听数组的方法,也可以在父组件中用v-if来实现,考虑到实现效果的美观度建议用watch和watcheffect
子组件props用defineprops后 可以直接使用props.属性取值 我这里是直接使用toRefs,然后直接使用x.value实现
本文仅提供参考,是本人闲时所写笔记,如有错误,还请赐教,作者:阿蒙不萌,大家可以随意转载


 浙公网安备 33010602011771号