k8s日志收集
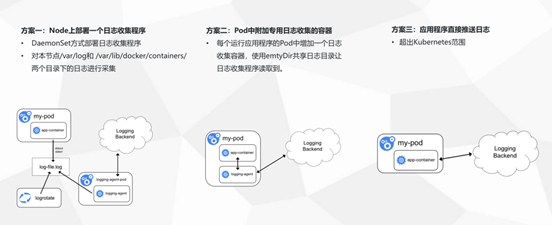
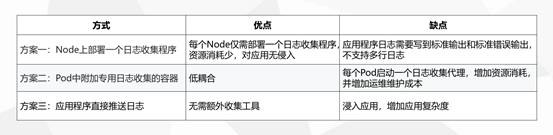
三种收集方案的优缺点:
下面我们就实践第二种日志收集方案
一:安装ELK
1.安装jdk
yum install -y java-1.8.0-openjdk
2.添加ELK源
cat << EOF >>/etc/yum.repos.d/logstash.repo
[logstash-7.x]
name=Elastic repository for 7.x packages
baseurl=https://artifacts.elastic.co/packages/7.x/yum
gpgcheck=1
gpgkey=https://artifacts.elastic.co/GPG-KEY-elasticsearch
enabled=1
autorefresh=1
type=rpm-md
EOF
3.安装ELK组件
yum install elasticsearch logstash kibana -y
或者:
elk下载地址
wget https://www.elastic.co/cn/downloads/
get https://artifacts.elastic.co/downloads/logstash/logstash-7.9.3.rpm
wget https://artifacts.elastic.co/downloads/kibana/kibana-7.9.3-x86_64.rpm
wget https://artifacts.elastic.co/downloads/elasticsearch/elasticsearch-7.9.3-x86_64.rpm
wget https://artifacts.elastic.co/downloads/beats/filebeat/filebeat-7.6.1-x86_64.rpm
yum install -y *.rpm

4.修改kibana的配置文件
[root@master ~]# grep -Ev '^$|^#' /etc/kibana/kibana.yml
server.port: 5601
server.host: "0.0.0.0"
elasticsearch.hosts: ["http://localhost:9200"]

5.启动服务
systemctl start elasticsearch && systemctl enable elasticsearch && systemctl status elasticsearch
systemctl start kibana && systemctl enabel kibana && systemctl status kibana
二、收集K8S的日志
1、添加logstash配置文件
cat >/etc/logstash/conf.d/logstash-to-es.conf <<EOF
input {
  beats {
     port => 5044
  }
}
filter {
}
output {
       if [app] == "k8s" {
        if [type] == "module" {
           elasticsearch {
              hosts => ["http://127.0.0.1:9200"]
              index => "k8s-log-%{+YYYY.MM.dd}"
           }
        }
    }
}
EOF
2、启动logstash
/usr/share/logstash/bin/logstash -f /etc/logstash/conf.d/logstash-to-es.conf &
3、创建filebeat的yaml文件
cat >k8s-logs.yaml <<EOF
apiVersion: v1
kind: ConfigMap
metadata:
  name: k8s-logs-filebeat-config
  namespace: kube-system
data:
  filebeat.yml: |-
    filebeat.prospectors:
      - type: log
        paths:
          - /messages
        fields:
          app: k8s
          type: module
        fields_under_root: true
     output.logstash:
      hosts: ['192.168.10.170:5044']
---
apiVersion: apps/v1
kind: DaemonSet
metadata:
  name: k8s-logs
  namespace: kube-system
spec:
  selector:
    matchLabels:
      project: k8s
      app: filebeat
  template:
    metadata:
      labels:
        project: k8s
        app: filebeat
    spec:
      containers:
      - name: filebeat
        image: docker.elastic.co/beats/filebeat:6.4.2
        args: [
          "-c", "/etc/filebeat.yml",
          "-e",
        ]
        resources:
          requests:
            cpu: 100m
            memory: 100Mi
          limits:
            cpu: 500m
            memory: 500Mi
        securityContext:
          runAsUser: 0
        volumeMounts:
        - name: filebeat-config
          mountPath: /etc/filebeat.yml
          subPath: filebeat.yml
        - name: k8s-logs
          mountPath: /messages
      volumes:
      - name: k8s-logs
        hostPath:
          path: /var/log/messages
          type: File
      - name: filebeat-config
        configMap:
          name: k8s-logs-filebeat-config
 EOF
4、创建pod
kubectl apply -f k8s-logs.yaml
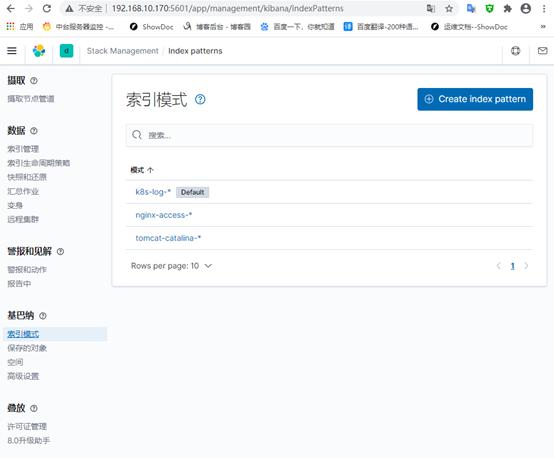
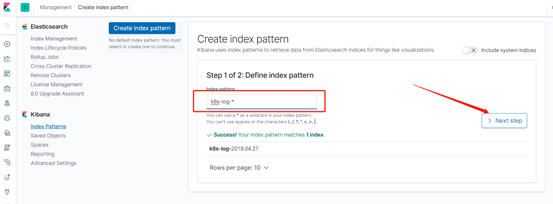
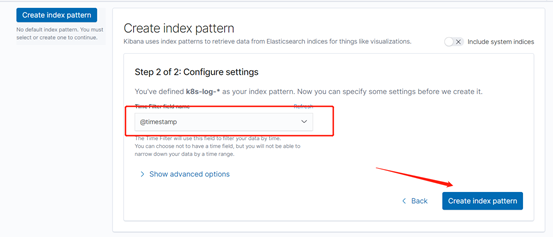
5、kibana添加索引
管理-->堆栈管理-->索引模式
三、收集NGINX日志
1、创建nginx-deployment
默认的日志路径为:/var/log/nginx/
[root@master logs]# cat >nginx-deployment.yaml <<EOF
apiVersion: apps/v1beta1
kind: Deployment
metadata:
  name: nginx-demo
spec:
  replicas: 3
  selector:
    matchLabels:
      project: www
      app: www
  template:
    metadata:
      labels:
        project: www
        app: www
    spec:
      imagePullSecrets:
      - name: registry-pull-secret
      containers:
      - name: nginx
        image: nginx:latest
        imagePullPolicy: Always
        ports:
        - containerPort: 80
          name: web
          protocol: TCP
        resources:
          requests:
            cpu: 0.5
            memory: 256Mi
          limits:
            cpu: 1
            memory: 1Gi
        resources:
          requests:
            cpu: 0.5
            memory: 256Mi
          limits:
            cpu: 1
            memory: 1Gi
        livenessProbe:
          httpGet:
            path: /index.html
            port: 80
          initialDelaySeconds: 6
          timeoutSeconds: 20
        volumeMounts:
        - name: nginx-logs
          mountPath: /var/log/nginx/
      - name: filebeat
        image: docker.elastic.co/beats/filebeat:6.4.2
        args: [
          "-c", "/etc/filebeat.yml",
          "-e",
        ]
        resources:
          limits:
            memory: 500Mi
          requests:
            cpu: 100m
            memory: 100Mi
        securityContext:
          runAsUser: 0
        volumeMounts:
        - name: filebeat-config
          mountPath: /etc/filebeat.yml
          subPath: filebeat.yml
        - name: nginx-logs
          mountPath: /var/log/nginx/

      volumes:
      - name: nginx-logs
        emptyDir: {}
      - name: filebeat-config
        configMap:
          name: filebeat-nginx-config
 EOF
2、创建filebest收集日志
cat >filebeat-nginx-configmap.yaml <<EOF
apiVersion: v1
kind: ConfigMap
metadata:
  name: filebeat-nginx-config
data:
  filebeat.yml: |-
    filebeat.prospectors:
      - type: log
        paths:
          - /var/log/nginx/access.log
        # tags: ["access"]
        fields:
          app: www
          type: nginx-access
        fields_under_root: true
      - type: log
        paths:
          - /var/log/nginx/error.log
        # tags: ["error"]
        fields:
          app: www
          type: nginx-error
        fields_under_root: true
    output.logstash:
      hosts: ['192.168.10.170:5044']
EOF
3、添加logstas配置
cat >/etc/logstash/conf.d/logstash-to-es.conf <<EOF
input {
  beats {
     port => 5044
  }
}
filter {
}
output {
    if [app] == "www" {
        if [type] == "nginx-access" {
           elasticsearch {
              hosts => ["http://127.0.0.1:9200"]
              index => "nginx-access-%{+YYYY.MM.dd}"
           }
        }
        else if [type] == "nginx-error" {
           elasticsearch {
              hosts => ["http://127.0.0.1:9200"]
              index => "nginx-error-%{+YYYY.MM.dd}"
           }
        }
    } else if [app] == "k8s" {
        if [type] == "module" {
           elasticsearch {
              hosts => ["http://127.0.0.1:9200"]
              index => "k8s-log-%{+YYYY.MM.dd}"
           }
        }
    }
}
EOF
4、生效清单文件
kubectl apply -f nginx-deployment.yaml
kubectl apply -f filebeat-nginx-configmap.yaml
5、修改完成配置文件需要重启logstash服务
ps -ef |grep logstash|awk -F [" "]+ 'NR==1 {print $2}' |xargs  kill
/usr/share/logstash/bin/logstash -f /etc/logstash/conf.d/logstash-to-es.conf &
6、kibana添加索引

四、收集Tomcat日志
1、创建tomcat-deployment
默认的日志路径为:/usr/local/tomcat/logs
cat >tomcat-deployment.yaml <<EOF
apiVersion: apps/v1beta1
kind: Deployment
metadata:
  name: tomcat-java-demo
spec:
  replicas: 3
  selector:
    matchLabels:
      project: www
      app: www
  template:
    metadata:
      labels:
        project: www
        app: www
    spec:
      imagePullSecrets:
      - name: registry-pull-secret
      containers:
      - name: tomcat
        image: tomcat:latest
        imagePullPolicy: Always
        ports:
        - containerPort: 8080
          name: web
          protocol: TCP
        resources:
          requests:
            cpu: 0.5
            memory: 1Gi
          limits:
            cpu: 1
            memory: 2Gi
        livenessProbe:
          httpGet:
            path: /
            port: 8080
          initialDelaySeconds: 60
          timeoutSeconds: 20
        readinessProbe:
          httpGet:
            path: /
            port: 8080
          initialDelaySeconds: 60
          timeoutSeconds: 20
        volumeMounts:
        - name: tomcat-logs
          mountPath: /usr/local/tomcat/logs
      - name: filebeat
        image: docker.elastic.co/beats/filebeat:6.4.2
        args: [
          "-c", "/etc/filebeat.yml",
          "-e",
        ]
        resources:
          limits:
            memory: 500Mi
          requests:
            cpu: 100m
            memory: 100Mi
        securityContext:
          runAsUser: 0
        volumeMounts:
        - name: filebeat-config
          mountPath: /etc/filebeat.yml
          subPath: filebeat.yml
        - name: tomcat-logs
          mountPath: /usr/local/tomcat/logs
      volumes:
      - name: tomcat-logs
        emptyDir: {}
      - name: filebeat-config
        configMap:
          name: filebeat-config
EOF
2、创建filebest收集tomcat日志
cat >filebeat-tomcat-configmap.yaml <<EOF
apiVersion: v1
kind: ConfigMap
metadata:
  name: filebeat-config
data:
  filebeat.yml: |-
    filebeat.prospectors:
    - type: log
      paths:
        - /usr/local/tomcat/logs/catalina.*
      fields:
        app: www
        type: tomcat-catalina
      fields_under_root: true
      multiline:
        pattern: '^\['
        negate: true
        match: after
    output.logstash:
      hosts: ['192.168.10.170:5044']
EOF
3、添加logstas配置后重启
cat >/etc/logstash/conf.d/logstash-to-es.conf <<EOF
input {
  beats {
     port => 5044
  }
}
filter {
}
output {
    if [app] == "www" {
        if [type] == "nginx-access" {
           elasticsearch {
              hosts => ["http://127.0.0.1:9200"]
              index => "nginx-access-%{+YYYY.MM.dd}"
           }
        }
        else if [type] == "nginx-error" {
           elasticsearch {
              hosts => ["http://127.0.0.1:9200"]
              index => "nginx-error-%{+YYYY.MM.dd}"
           }
        }
        else if [type] == "tomcat-catalina" {
           elasticsearch {
              hosts => ["http://127.0.0.1:9200"]
              index => "tomcat-catalina-%{+YYYY.MM.dd}"
           }
        }
    } else if [app] == "k8s" {
        if [type] == "module" {
           elasticsearch {
              hosts => ["http://127.0.0.1:9200"]
              index => "k8s-log-%{+YYYY.MM.dd}"
           }
        }
    }
}
EOF
生效清单文件
kubectl apply -f tomcat-deployment.yaml
kubectl apply -f filebeat-tomcat-configmap.yaml
3、添加logstas配置
cat >/etc/logstash/conf.d/logstash-to-es.conf <<EOF
input {
  beats {
     port => 5044
  }
}
filter {
}
output {
    if [app] == "www" {
        if [type] == "nginx-access" {
           elasticsearch {
              hosts => ["http://127.0.0.1:9200"]
              index => "nginx-access-%{+YYYY.MM.dd}"
           }
        }
        else if [type] == "nginx-error" {
           elasticsearch {
              hosts => ["http://127.0.0.1:9200"]
              index => "nginx-error-%{+YYYY.MM.dd}"
           }
        }
        else if [type] == "tomcat-catalina" {
           elasticsearch {
              hosts => ["http://127.0.0.1:9200"]
              index => "tomcat-catalina-%{+YYYY.MM.dd}"
           }
        }
    } else if [app] == "k8s" {
        if [type] == "module" {
           elasticsearch {
              hosts => ["http://127.0.0.1:9200"]
              index => "k8s-log-%{+YYYY.MM.dd}"
           }
        }
    }
}
EOF
修改完成配置文件需要重启服务
ps -ef |grep logstash|awk -F [" "]+ 'NR==1 {print $2}' |xargs  kill
/usr/share/logstash/bin/logstash -f /etc/logstash/conf.d/logstash-to-es.conf &
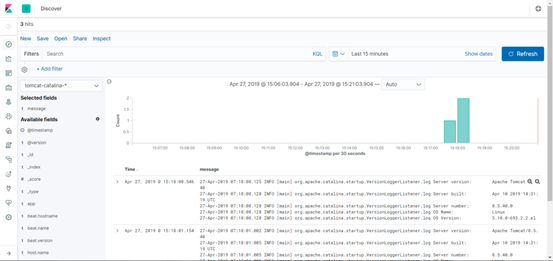
3、kibana添加索引
ElasticSearch
ElasticSearch 是一个高可用开源全文检索和分析组件。提供存储服务,搜索服务,大数据准实时分析等。一般用于提供一些提供复杂搜索的应用
基本概念:
Index
定义:类似于mysql中的database。索引只是一个逻辑上的空间,物理上是分为多个文件来管理的。
命名:必须全小写
描述:在实践过程中每个index都会有一个相应的副
本。主要用来在硬件出现问题时,用来回滚数据的。这也某种程序上,加剧了ES对于内存高要求。
Type
定义:类似于mysql中的table,根据用户需求每个index中可以新建任意数量的type。
Document
定义:对应mysql中的row。有点类似于MongoDB中的文档结构,每个Document是一个json格式的文本
Mapping
更像是一个用来定义每个字段类型的语义规范。在mysql中类似sql语句,在ES中经过包装后,都被封装为友好的Restful风格的接口进行操作。
这一点也是为什么开发人员更愿意使用ES的原因。
Shards & Replicas
定义:能够为每个索引提供水平的扩展以及备份操作。保证了数据的完整性和安全性
描述:
Shards:在单个节点中,index的存储始终是有限制,并且随着存储的增大会带来性能的问题。为了解决这个问题,ElasticSearch提供一个能够分割单个index到集群各个节点的功能。你可以在新建这个索引时,手动的定义每个索引分片的数量。
Replicas:在每个node出现宕机或者下线的情况,Replicas能够在该节点下线的同时将副本同时自动分配到其他仍然可用的节点。而且在提供搜索的同时,允许进行扩展节点的数量,在这个期间并不会出现服务终止的情况。
默认情况下,每个索引会分配5个分片,并且对应5个分片副本,同时会出现一个完整的副本【包括5个分配的副本数据】
elasticsearch常用命令
curl -X GET http://127.0.0.1:9200                          #验证服务
curl -XGET ‘http://localhost:9200/_cluster/stats?pretty’   #elasticsearch 查看集群统计信息
curl -X GET ‘localhost:9200/_cat/health?v’                 #查看集群状态
curl -X PUT HTTP://localhost:9200/test_index?pretty        #创建索引:test_index
curl -X GET HTTP://localhost:9200/cat/indices?v           #elasticsearch 查看所有索引
curl -s http://192.168.10.170:9200/_cat/indices|grep “msg”|awk ‘{print $3}’|sort
curl -XDELETE ‘localhost:9200/test_index?pretty’         #删除索引:test_index
logstash工作原理
Logstash事件处理有三个阶段:
inputs → filters → outputs。是一个接收,处理,转发日志的工具。
支持系统日志,webserver日志,错误日志,应用日志,包括所有可以抛出来的日志类型。
Input模块:输入数据到logstash。
一些常用的输入为:
file:从文件系统的文件中读取,类似于tail-f命令
redis:从redis service中读取
beats:从filebeat中读取
kafka:从kafka队列中读取
Filters:数据中间处理,对数据进行操作。
一些常用的过滤器为:
grok:解析任意文本数据,Grok 是 Logstash 最重要的插件。
它的主要作用就是将文本格式的字符串,转换成为具体的结构化的数据,配合正则表达式使用。内置120多个解析语法。
官方提供的grok表达式:https://github.com/logstash-plugins/logstash-patterns-core/tree/master/patterns
grok在线调试:https://grokdebug.herokuapp.com/
mutate [ˈmjuːteɪt]:对字段进行转换。
例如对字段进行删除、替换、修改、重命名等。
drop:丢弃一部分events不进行处理。
clone:拷贝 event,这个过程中也可以添加或移除字段。
geoip:添加地理信息(为前台kibana图形化展示使用)
Outputs模块:outputs是logstash处理管道的最末端组件。
一个event可以在处理过程中经过多重输出,但是一旦所有的outputs都执行结束,这个event也就完成生命周期。
一些常见的outputs为:
elasticsearch:可以高效的保存数据,并且能够方便和简单的进行查询。
file:将event数据保存到文件中。
graphite
[ˈɡræfaɪt]:将event数据发送到图形化组件中,一个很流行的开源存储图形化展示的组件。
Codecs模块:codecs 是基于数据流的过滤器,它可以作为input,output的一部分配置。Codecs可以帮助你轻松的分割发送过来已经被序列化的数据。
一些常见的codecs:
json:使用json格式对数据进行编码/解码。
multiline:将汇多个事件中数据汇总为一个单一的行。比如:java异常信息和堆栈信息
Kibana
Kibana是一个针对Elasticsearch的开源分析及可视化平台,用来搜索、查看交互存储在Elasticsearch索引中的数据。使用Kibana,可以通过各种图表进行高级数据分析及展示。
Kibana让海量数据更容易理解。它操作简单,基于浏览器的用户界面可以快速创建仪表板(dashboard)实时显示Elasticsearch查询动态。
设置Kibana非常简单。无需编码或者额外的基础架构,几分钟内就可以完成Kibana安装并启动Elasticsearch索引监测。
参考地址:https://blog.csdn.net/mazhiwb/article/details/105775199
https://www.cnblogs.com/Dev0ps/p/10778962.html

 浙公网安备 33010602011771号