
Vue+Echarts2 (dianshang)
vue+echart实战2(dianshang)
效果图
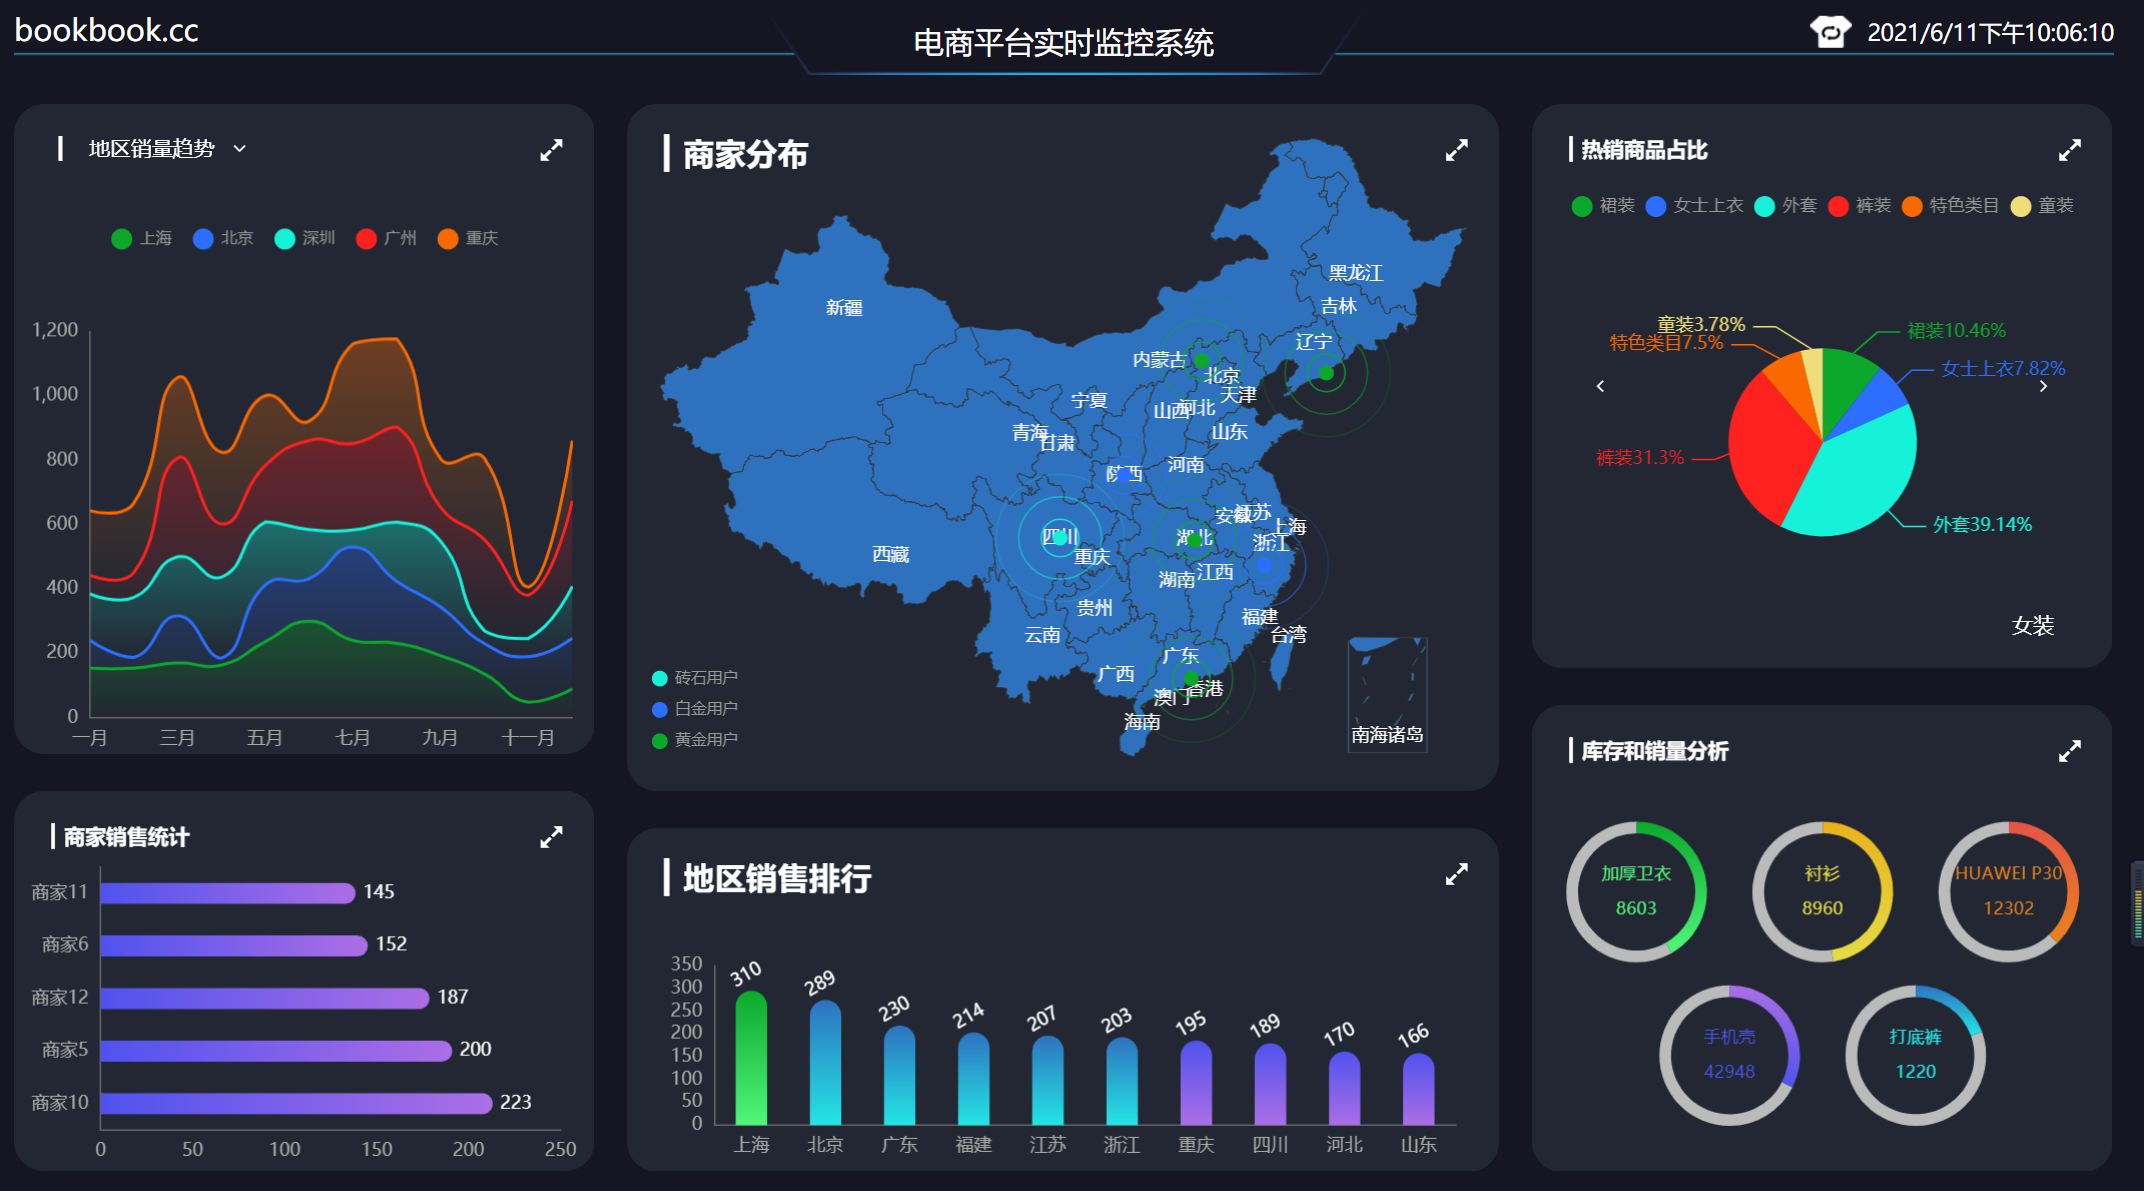
1 地区销量趋势(多选项+图例)
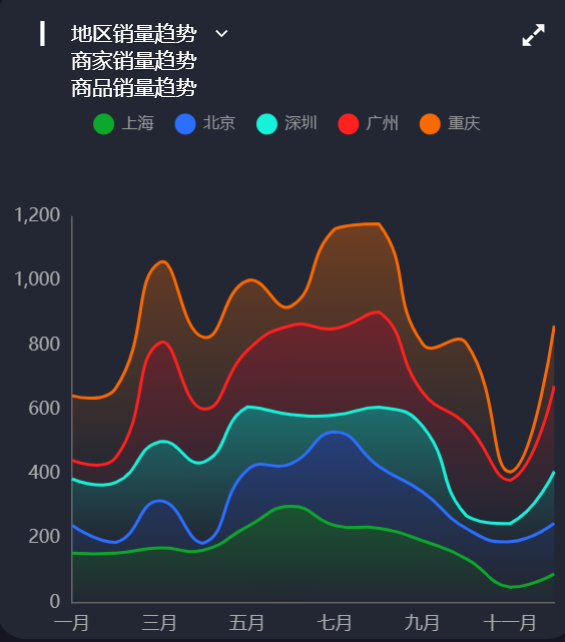


{
    "map": {
        "title": "地区销量趋势",
        "base": 310,
        "unit": "万",
        "data": [{
            "name": "上海",
            "data": ["155.13","154.65","171.46","164.38","237.23","300.65","240.29","232.07","193.31","136.70","48.64","90.20"]
        }, {
            "name": "北京",
            "data": ["86.25","33.80","145.58","21.79","176.09","132.41","291.05","191.89","151.54","94.25","141.75","157.14"]
        }, {
            "name": "深圳",
            "data": ["143.94","186.29","183.64","251.48","195.48","152.16","52.47","184.12","203.79","39.16","56.37","161.64"]
        }, {
            "name": "广州",
            "data": ["57.60","77.61","307.24","165.05","175.41","276.88","269.04","296.11","105.31","283.39","134.08","265.38"]
        }, {
            "name": "重庆",
            "data": ["200.82","215.56","249.80","222.67","216.98","60.12","309.68","273.35","150.99","251.97","26.15","186.99"]
        }]
    },
    "seller": {
        "title": "商家销量趋势",
        "base": 120,
        "unit": "万",
        "data": [{
            "name": "商家1",
            "data": ["33.00","86.07","28.77","34.29","102.45","0.30","50.50","21.70","25.41","25.71","66.90","63.29"]
        }, {
            "name": "商家2",
            "data": ["12.83","102.42","37.37","95.55","45.45","112.72","113.53","106.41","75.67","113.91", "37.32", "28.04"]
        }, {
            "name": "商家3",
            "data": ["73.54","40.92","89.81","113.41","76.34","107.15","55.61","0.33","106.29","78.30","98.05","38.67"]
        }, {
            "name": "商家4",
            "data": ["47.19","73.57","44.60","84.03","62.82","15.65","64.72","88.98","29.25","5.41","79.11","118.46"]
        }, {
            "name": "商家5",
            "data": ["74.84","116.45","107.69","11.03","17.31","42.22","97.60","108.64","43.87","110.65","5.96","38.41"]
        }]
    },
    "commodity": {
        "title": "商品销量趋势",
        "base": 50,
        "unit": "万",
        "data": [{
            "name": "女装",
            "data": ["47.71","13.34","19.30","7.93","41.93","23.01","22.63","26.91","0.62","39.23","48.74","29.48"]
        }, {
            "name": "手机数码",
            "data": ["46.66","46.52","23.65","1.73","44.26","47.07","17.86","40.20","3.78","31.46","28.01","8.63"]
        }, {
            "name": "男装",
            "data": ["26.98","30.71","42.59","29.50","26.86","17.65","30.15","15.85","9.28","30.20","32.35","34.46"]
        }, {
            "name": "大家电",
            "data": ["20.26","46.23","43.84","46.75","28.29","32.36","45.30","16.73","40.40","45.07","29.86","41.92"]
        }, {
            "name": "美妆护肤",
            "data": ["7.58","23.66","39.78","30.20","25.72","36.20","47.55","35.39","27.85","37.56","16.91", "3.91"]
        }]
    },
    "common": {
        "month": ["一月", "二月", "三月", "四月", "五月", "六月", "七月", "八月", "九月", "十月", "十一月", "十二月"]
    },
    "type": [{
        "key": "map",
        "text": "地区销量趋势"
    }, {
        "key": "seller",
        "text": "商家销量趋势"
    }, {
        "key": "commodity",
        "text": "商品销量趋势"
    }]
}
<template> <div class="com-container"> <div class="title" :style="comStyle"> <span>{{ '▎ ' + showTitle }}</span> <span class="iconfont title-icon" :style="comStyle" @click="showChoice = !showChoice"></span> <div class="select-con" v-show="showChoice" :style="marginStyle"> <div class="select-item" v-for="item in selectTypes" :key="item.key" @click="handleSelect(item.key)"> {{ item.text }} </div> </div> </div> <div class="com-chart" ref="trend_ref"></div> </div> </template> <script> import { mapState } from 'vuex' import { getThemeValue } from '@/utils/theme_utils' export default { data () { return { chartInstane: null, allData: null, // 从服务器中获取的所有数据 showChoice: false, // 是否显示可选项 choiceType: 'map', // 显示的数据类型 titleFontSize: 0 // 指明标题的字体大小 } }, created () { // 在组件创建完成之后 进行回调函数的注册 this.$socket.registerCallBack('trendData', this.getData) }, mounted () { this.initChart() // this.getData() // 发送数据给服务器, 告诉服务器, 我现在需要数据 this.$socket.send({ action: 'getData', socketType: 'trendData', chartName: 'trend', value: '' }) window.addEventListener('resize', this.screenAdapter) this.screenAdapter() }, destroyed () { window.removeEventListener('resize', this.screenAdapter) // 在组件销毁的时候, 进行回调函数的取消 this.$socket.unRegisterCallBack('trendData') }, computed: { selectTypes () { if (!this.allData) { return [] } else { return this.allData.type.filter(item => { return item.key !== this.choiceType }) } }, showTitle () { if (!this.allData) { return '' } else { return this.allData[this.choiceType].title } }, // 设置给标题的样式 comStyle () { return { fontSize: this.titleFontSize + 'px', color: getThemeValue(this.theme).titleColor } }, marginStyle () { return { marginLeft: this.titleFontSize + 'px' } }, ...mapState(['theme']) }, methods: { initChart () { this.chartInstane = this.$echarts.init(this.$refs.trend_ref, this.theme) const initOption = { grid: { left: '3%', top: '35%', right: '4%', bottom: '1%', containLabel: true }, tooltip: { trigger: 'axis' }, legend: { left: 20, top: '15%', icon: 'circle' }, xAxis: { type: 'category', boundaryGap: false }, yAxis: { type: 'value' } } this.chartInstane.setOption(initOption) }, // ret 就是服务端发送给客户端的图表的数据 getData (ret) { // await this.$http.get() // 对allData进行赋值 // const { data: ret } = await this.$http.get('trend') this.allData = ret console.log(this.allData) this.updateChart() }, updateChart () { // 半透明的颜色值 const colorArr1 = [ 'rgba(11, 168, 44, 0.5)', 'rgba(44, 110, 255, 0.5)', 'rgba(22, 242, 217, 0.5)', 'rgba(254, 33, 30, 0.5)', 'rgba(250, 105, 0, 0.5)' ] // 全透明的颜色值 const colorArr2 = [ 'rgba(11, 168, 44, 0)', 'rgba(44, 110, 255, 0)', 'rgba(22, 242, 217, 0)', 'rgba(254, 33, 30, 0)', 'rgba(250, 105, 0, 0)' ] // 处理数据 // 类目轴的数据 const timeArr = this.allData.common.month // y轴的数据 series下的数据 const valueArr = this.allData[this.choiceType].data const seriesArr = valueArr.map((item, index) => { return { name: item.name, type: 'line', data: item.data, stack: this.choiceType, areaStyle: { color: new this.$echarts.graphic.LinearGradient(0, 0, 0, 1, [ { offset: 0, color: colorArr1[index] }, // %0的颜色值 { offset: 1, color: colorArr2[index] } // 100%的颜色值 ]) } } }) // 图例的数据 const legendArr = valueArr.map(item => { return item.name }) const dataOption = { xAxis: { data: timeArr }, legend: { data: legendArr }, series: seriesArr } this.chartInstane.setOption(dataOption) }, screenAdapter () { this.titleFontSize = this.$refs.trend_ref.offsetWidth / 100 * 3.6 const adapterOption = { legend: { itemWidth: this.titleFontSize, itemHeight: this.titleFontSize, itemGap: this.titleFontSize, textStyle: { fontSize: this.titleFontSize / 2 } } } this.chartInstane.setOption(adapterOption) this.chartInstane.resize() }, handleSelect (currentType) { this.choiceType = currentType this.updateChart() this.showChoice = false } }, watch: { theme () { console.log('主题切换了') this.chartInstane.dispose() // 销毁当前的图表 this.initChart() // 重新以最新的主题名称初始化图表对象 this.screenAdapter() // 完成屏幕的适配 this.updateChart() // 更新图表的展示 } } } </script> <style lang="less" scoped> .title { position: absolute; left: 20px; top: 20px; z-index: 10; color: white; .title-icon { margin-left: 10px; cursor: pointer; } .select-con { background-color: #222733; } } </style>
2商家销售统计(纵轴动态显示)
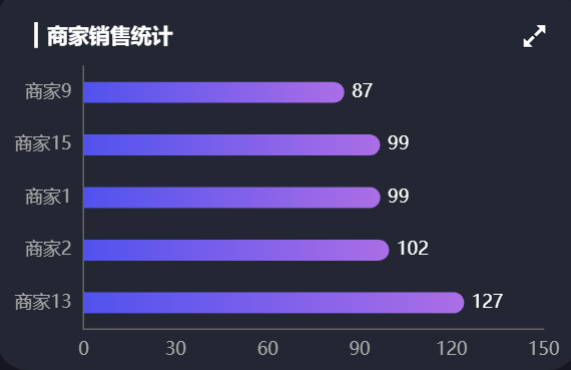
[{
    "name": "商家1",
    "value": 99
}, {
    "name": "商家2",
    "value": 102
}, {
    "name": "商家3",
    "value": 83
}, {
    "name": "商家4",
    "value": 49
}, {
    "name": "商家5",
    "value": 200
}, {
    "name": "商家6",
    "value": 152
}, {
    "name": "商家7",
    "value": 76
}, {
    "name": "商家8",
    "value": 23
}, {
    "name": "商家9",
    "value": 87
}, {
    "name": "商家10",
    "value": 223
}, {
    "name": "商家11",
    "value": 145
}, {
    "name": "商家12",
    "value": 187
},{
    "name": "商家13",
    "value": 127
},{
    "name": "商家14",
    "value": 57
},{
    "name": "商家15",
    "value": 99
}]
<!-- 商家销量统计的横向柱状图 -->
<template>
  <div class="com-container">
    <div class="com-chart" ref="seller_ref"></div>
  </div>
</template>

<script>
import { mapState } from 'vuex'
export default {
  data () {
    return {
      chartInstance: null,
      allData: null, // 服务器返回的数据
      currentPage: 1, // 当前显示的页数
      totalPage: 0, // 一共有多少页
      timerId: null // 定时器的标识
    }
  },
  created () {
    // 在组件创建完成之后 进行回调函数的注册
    this.$socket.registerCallBack('sellerData', this.getData)
  },
  mounted () {
    this.initChart()
    // this.getData()
    this.$socket.send({
      action: 'getData',
      socketType: 'sellerData',
      chartName: 'seller',
      value: ''
    })
    window.addEventListener('resize', this.screenAdapter)
    // 在页面加载完成的时候, 主动进行屏幕的适配
    this.screenAdapter()
  },
  destroyed () {
    clearInterval(this.timerId)
    // 在组件销毁的时候, 需要将监听器取消掉
    window.removeEventListener('resize', this.screenAdapter)
    this.$socket.unRegisterCallBack('sellerData')
  },
  methods: {
    // 初始化echartInstance对象
    initChart () {
      this.chartInstance = this.$echarts.init(this.$refs.seller_ref, this.theme)
      // 对图表初始化配置的控制
      const initOption = {
        title: {
          text: '▎商家销售统计',
          left: 20,
          top: 20
        },
        grid: {
          top: '20%',
          left: '3%',
          right: '6%',
          bottom: '3%',
          containLabel: true // 距离是包含坐标轴上的文字
        },
        xAxis: {
          type: 'value'
        },
        yAxis: {
          type: 'category'
        },
        tooltip: {
          trigger: 'axis',
          axisPointer: {
            type: 'line',
            z: 0,
            lineStyle: {
              color: '#2D3443'
            }
          }
        },
        series: [
          {
            type: 'bar',
            label: {
              show: true,
              position: 'right',
              textStyle: {
                color: 'white'
              }
            },
            itemStyle: {
              // 指明颜色渐变的方向
              // 指明不同百分比之下颜色的值
              color: new this.$echarts.graphic.LinearGradient(0, 0, 1, 0, [
                // 百分之0状态之下的颜色值
                {
                  offset: 0,
                  color: '#5052EE'
                },
                // 百分之100状态之下的颜色值
                {
                  offset: 1,
                  color: '#AB6EE5'
                }
              ])
            }
          }
        ]
      }
      this.chartInstance.setOption(initOption)
      // 对图表对象进行鼠标事件的监听
      this.chartInstance.on('mouseover', () => {
        clearInterval(this.timerId)
      })
      this.chartInstance.on('mouseout', () => {
        this.startInterval()
      })
    },
    // 获取服务器的数据
    getData (ret) {
      // http://127.0.0.1:8888/api/seller
      // const { data: ret } = await this.$http.get('seller')
      this.allData = ret
      // 对数据排序
      this.allData.sort((a, b) => {
        return a.value - b.value // 从小到大的排序
      })
      // 每5个元素显示一页
      this.totalPage = this.allData.length % 5 === 0 ? this.allData.length / 5 : this.allData.length / 5 + 1
      this.updateChart()
      // 启动定时器
      this.startInterval()
    },
    // 更新图表
    updateChart () {
      const start = (this.currentPage - 1) * 5
      const end = this.currentPage * 5
      const showData = this.allData.slice(start, end)
      const sellerNames = showData.map((item) => {
        return item.name
      })
      const sellerValues = showData.map((item) => {
        return item.value
      })
      const dataOption = {
        yAxis: {
          data: sellerNames
        },
        series: [
          {
            data: sellerValues
          }
        ]
      }
      this.chartInstance.setOption(dataOption)
    },
    startInterval () {
      if (this.timerId) {
        clearInterval(this.timerId)
      }
      this.timerId = setInterval(() => {
        this.currentPage++
        if (this.currentPage > this.totalPage) {
          this.currentPage = 1
        }
        this.updateChart()
      }, 3000)
    },
    // 当浏览器的大小发生变化的时候, 会调用的方法, 来完成屏幕的适配
    screenAdapter () {
      // console.log(this.$refs.seller_ref.offsetWidth)
      const titleFontSize = this.$refs.seller_ref.offsetWidth / 100 * 3.6
      // 和分辨率大小相关的配置项
      const adapterOption = {
        title: {
          textStyle: {
            fontSize: titleFontSize
          }
        },
        tooltip: {
          axisPointer: {
            lineStyle: {
              width: titleFontSize
            }
          }
        },
        series: [
          {
            barWidth: titleFontSize,
            itemStyle: {
              barBorderRadius: [0, titleFontSize / 2, titleFontSize / 2, 0]
            }
          }
        ]
      }
      this.chartInstance.setOption(adapterOption)
      // 手动的调用图表对象的resize 才能产生效果
      this.chartInstance.resize()
    }
  },
  computed: {
    ...mapState(['theme'])
  },
  watch: {
    theme () {
      console.log('主题切换了')
      this.chartInstance.dispose() // 销毁当前的图表
      this.initChart() // 重新以最新的主题名称初始化图表对象
      this.screenAdapter() // 完成屏幕的适配
      this.updateChart() // 更新图表的展示
    }
  }
}
</script>

<style lang="less" scoped>
</style>
3 地区销量排行(横轴动态显示)
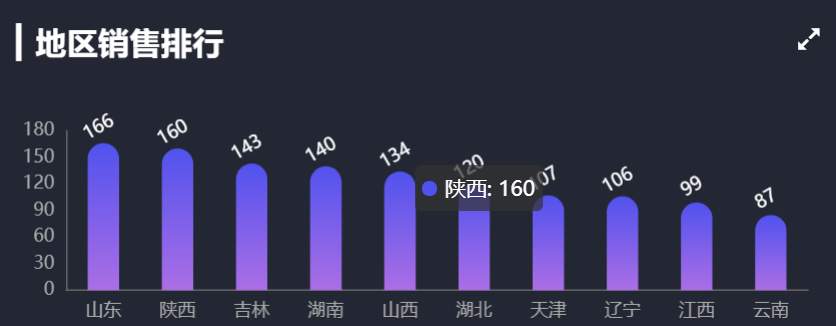
[
    {
        "name": "广东",
        "value": 230
    },
    {
        "name": "福建",
        "value": 214
    },
    {
        "name": "浙江",
        "value": 203
    },
    {
        "name": "上海",
        "value": 310
    },
    {
        "name": "北京",
        "value": 289
    },
    {
        "name": "江苏",
        "value": 207
    },
    {
        "name": "四川",
        "value": 189
    },
    {
        "name": "重庆",
        "value": 195
    },
    {
        "name": "陕西",
        "value": 160
    },
    {
        "name": "湖南",
        "value": 140
    },
    {
        "name": "河北",
        "value": 170
    },
    {
        "name": "辽宁",
        "value": 106
    },
    {
        "name": "湖北",
        "value": 120
    },
    {
        "name": "江西",
        "value": 99
    },
    {
        "name": "天津",
        "value": 107
    },
    {
        "name": "吉林",
        "value": 143
    },
    {
        "name": "青海",
        "value": 65
    },
    {
        "name": "山东",
        "value": 166
    },
    {
        "name": "山西",
        "value": 134
    },
    {
        "name": "云南",
        "value": 87
    },
    {
        "name": "安徽",
        "value": 79
    }
]
<!-- 地区销售排行 -->
<template>
  <div class='com-container'>
    <div class='com-chart' ref='rank_ref'></div>
  </div>
</template>

<script>
import { mapState } from 'vuex'
export default {
  data () {
    return {
      chartInstance: null,
      allData: null,
      startValue: 0, // 区域缩放的起点值
      endValue: 9, // 区域缩放的终点值
      timerId: null // 定时器的标识
    }
  },
  created () {
    // 在组件创建完成之后 进行回调函数的注册
    this.$socket.registerCallBack('rankData', this.getData)
  },
  mounted () {
    this.initChart()
    // this.getData()
    this.$socket.send({
      action: 'getData',
      socketType: 'rankData',
      chartName: 'rank',
      value: ''
    })
    window.addEventListener('resize', this.screenAdapter)
    this.screenAdapter()
  },
  destroyed () {
    window.removeEventListener('resize', this.screenAdapter)
    clearInterval(this.timerId)
    this.$socket.unRegisterCallBack('rankData')
  },
  methods: {
    initChart () {
      this.chartInstance = this.$echarts.init(this.$refs.rank_ref, this.theme)
      const initOption = {
        title: {
          text: '▎ 地区销售排行',
          left: 20,
          top: 20
        },
        grid: {
          top: '40%',
          left: '5%',
          right: '5%',
          bottom: '5%',
          containLabel: true
        },
        tooltip: {
          show: true
        },
        xAxis: {
          type: 'category'
        },
        yAxis: {
          type: 'value'
        },
        series: [
          {
            type: 'bar'
          }
        ]
      }
      this.chartInstance.setOption(initOption)
      this.chartInstance.on('mouseover', () => {
        clearInterval(this.timerId)
      })
      this.chartInstance.on('mouseout', () => {
        this.startInterval()
      })
    },
    getData (ret) {
      // 获取服务器的数据, 对this.allData进行赋值之后, 调用updateChart方法更新图表
      // const { data: ret } = await this.$http.get('rank')
      this.allData = ret
      // 对allData里面的每一个元素进行排序, 从大到小进行
      this.allData.sort((a, b) => {
        return b.value - a.value
      })
      console.log(this.allData)
      this.updateChart()
      this.startInterval()
    },
    updateChart () {
      const colorArr = [
        ['#0BA82C', '#4FF778'],
        ['#2E72BF', '#23E5E5'],
        ['#5052EE', '#AB6EE5']
      ]
      // 处理图表需要的数据
      // 所有省份所形成的数组
      const provinceArr = this.allData.map(item => {
        return item.name
      })
      // 所有省份对应的销售金额
      const valueArr = this.allData.map(item => {
        return item.value
      })
      const dataOption = {
        xAxis: {
          data: provinceArr
        },
        dataZoom: {
          show: false,
          startValue: this.startValue,
          endValue: this.endValue
        },
        series: [
          {
            data: valueArr,
            itemStyle: {
              color: arg => {
                let targetColorArr = null
                if (arg.value > 300) {
                  targetColorArr = colorArr[0]
                } else if (arg.value > 200) {
                  targetColorArr = colorArr[1]
                } else {
                  targetColorArr = colorArr[2]
                }
                return new this.$echarts.graphic.LinearGradient(0, 0, 0, 1, [
                  {
                    offset: 0,
                    color: targetColorArr[0]
                  },
                  {
                    offset: 1,
                    color: targetColorArr[1]
                  }
                ])
              }
            }
          }
        ]
      }
      this.chartInstance.setOption(dataOption)
    },
    screenAdapter () {
      const titleFontSize = this.$refs.rank_ref.offsetWidth / 100 * 3.6
      const adapterOption = {
        title: {
          textStyle: {
            fontSize: titleFontSize
          }
        },
        series: [
          {
            barWidth: titleFontSize,
            itemStyle: {
              barBorderRadius: [titleFontSize / 2, titleFontSize / 2, 0, 0]
            }
          }
        ]
      }
      this.chartInstance.setOption(adapterOption)
      this.chartInstance.resize()
    },
    startInterval () {
      if (this.timerId) {
        clearInterval(this.timerId)
      }
      this.timerId = setInterval(() => {
        this.startValue++
        this.endValue++
        if (this.endValue > this.allData.length - 1) {
          this.startValue = 0
          this.endValue = 9
        }
        this.updateChart()
      }, 2000)
    }
  },
  computed: {
    ...mapState(['theme'])
  },
  watch: {
    theme () {
      console.log('主题切换了')
      this.chartInstance.dispose() // 销毁当前的图表
      this.initChart() // 重新以最新的主题名称初始化图表对象
      this.screenAdapter() // 完成屏幕的适配
      this.updateChart() // 更新图表的展示
    }
  }
}
</script>

<style lang='less' scoped>
</style>
4 商家分布
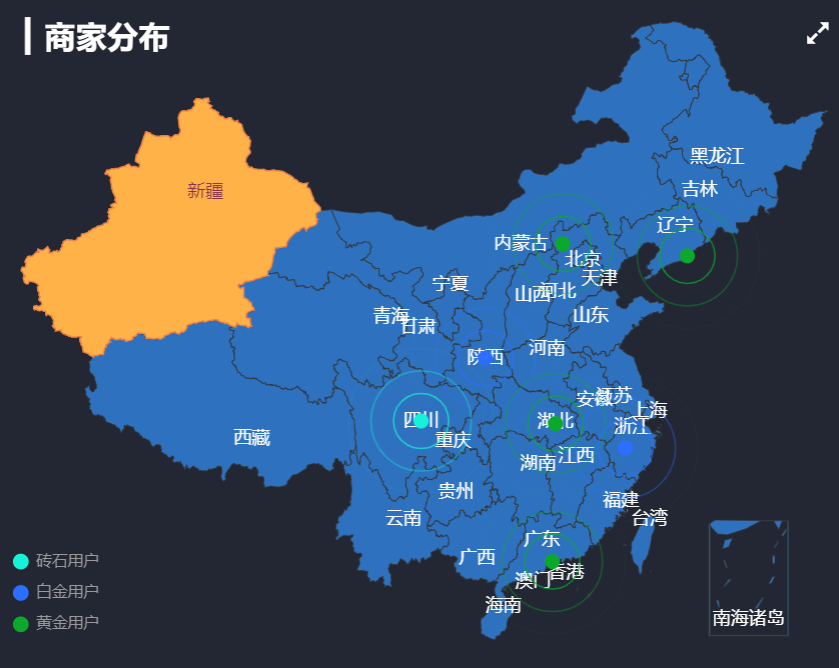
[
    {
        "name": "黄金用户",
        "children": [
            {
                "name": "武汉",
                "value": [114.31, 30.52]
            }, {
                "name": "丹东",
                "value": [124.37, 40.13]
            }, {
                "name": "张家口",
                "value": [114.87, 40.82]
            }, {
                "name": "深圳",
                "value": [114.07, 22.62]
            }
        ]
    },
    {
        "name": "白金用户",
        "children": [
            {
                "name": "金华",
                "value": [119.64, 29.12]
            }, {
                "name": "西安",
                "value": [108.95, 34.27]
            }
        ]
    },
    {
        "name": "砖石用户",
        "children": [
            {
                "name": "成都",
                "value": [104.06, 30.67]
            }
        ]
    }
]
<!-- 商家分布图表 -->
<template>
  <div class='com-container' @dblclick="revertMap">
    <div class='com-chart' ref='map_ref'></div>
  </div>
</template>

<script>
import { mapState } from 'vuex'
import axios from 'axios'
import { getProvinceMapInfo } from '@/utils/map_utils'
export default {
  data () {
    return {
      chartInstance: null,
      allData: null,
      mapData: {} // 所获取的省份的地图矢量数据
    }
  },
  created () {
    // 在组件创建完成之后 进行回调函数的注册
    this.$socket.registerCallBack('mapData', this.getData)
  },
  mounted () {
    this.initChart()
    // this.getData()
    this.$socket.send({
      action: 'getData',
      socketType: 'mapData',
      chartName: 'map',
      value: ''
    })
    window.addEventListener('resize', this.screenAdapter)
    this.screenAdapter()
  },
  destroyed () {
    window.removeEventListener('resize', this.screenAdapter)
    this.$socket.unRegisterCallBack('mapData')
  },
  methods: {
    async initChart () {
      this.chartInstance = this.$echarts.init(this.$refs.map_ref, this.theme)
      // 获取中国地图的矢量数据
      // http://localhost:8999/static/map/china.json
      // 由于我们现在获取的地图矢量数据并不是位于KOA2的后台, 所以咱们不能使用this.$http
      const ret = await axios.get('http://localhost:8999/static/map/china.json')
      this.$echarts.registerMap('china', ret.data)
      const initOption = {
        title: {
          text: '▎ 商家分布',
          left: 20,
          top: 20
        },
        geo: {
          type: 'map',
          map: 'china',
          top: '5%',
          bottom: '5%',
          itemStyle: {
            areaColor: '#2E72BF',
            borderColor: '#333'
          }
        },
        legend: {
          left: '5%',
          bottom: '5%',
          orient: 'vertical'
        }
      }
      this.chartInstance.setOption(initOption)
      this.chartInstance.on('click', async arg => {
        // arg.name 得到所点击的省份, 这个省份他是中文
        const provinceInfo = getProvinceMapInfo(arg.name)
        console.log(provinceInfo)
        // 需要获取这个省份的地图矢量数据
        // 判断当前所点击的这个省份的地图矢量数据在mapData中是否存在
        if (!this.mapData[provinceInfo.key]) {
          const ret = await axios.get('http://localhost:8999' + provinceInfo.path)
          this.mapData[provinceInfo.key] = ret.data
          this.$echarts.registerMap(provinceInfo.key, ret.data)
        }
        const changeOption = {
          geo: {
            map: provinceInfo.key
          }
        }
        this.chartInstance.setOption(changeOption)
      })
    },
    getData (ret) {
      // 获取服务器的数据, 对this.allData进行赋值之后, 调用updateChart方法更新图表
      // const { data: ret } = await this.$http.get('map')
      this.allData = ret
      console.log(this.allData)
      this.updateChart()
    },
    updateChart () {
      // 处理图表需要的数据
      // 图例的数据
      const legendArr = this.allData.map(item => {
        return item.name
      })
      const seriesArr = this.allData.map(item => {
        // return的这个对象就代表的是一个类别下的所有散点数据
        // 如果想在地图中显示散点的数据, 我们需要给散点的图表增加一个配置, coordinateSystem:geo
        return {
          type: 'effectScatter',
          rippleEffect: {
            scale: 5,
            brushType: 'stroke'
          },
          name: item.name,
          data: item.children,
          coordinateSystem: 'geo'
        }
      })
      const dataOption = {
        legend: {
          data: legendArr
        },
        series: seriesArr
      }
      this.chartInstance.setOption(dataOption)
    },
    screenAdapter () {
      const titleFontSize = this.$refs.map_ref.offsetWidth / 100 * 3.6
      const adapterOption = {
        title: {
          textStyle: {
            fontSize: titleFontSize
          }
        },
        legend: {
          itemWidth: titleFontSize / 2,
          itemHeight: titleFontSize / 2,
          itemGap: titleFontSize / 2,
          textStyle: {
            fontSize: titleFontSize / 2
          }
        }
      }
      this.chartInstance.setOption(adapterOption)
      this.chartInstance.resize()
    },
    // 回到中国地图
    revertMap () {
      const revertOption = {
        geo: {
          map: 'china'
        }
      }
      this.chartInstance.setOption(revertOption)
    }
  },
  computed: {
    ...mapState(['theme'])
  },
  watch: {
    theme () {
      console.log('主题切换了')
      this.chartInstance.dispose() // 销毁当前的图表
      this.initChart() // 重新以最新的主题名称初始化图表对象
      this.screenAdapter() // 完成屏幕的适配
      this.updateChart() // 更新图表的展示
    }
  }
}
</script>

<style lang='less' scoped>
</style>
const name2pinyin = {
  安徽: 'anhui',
  陕西: 'shanxi1',
  澳门: 'aomen',
  北京: 'beijing',
  重庆: 'chongqing',
  福建: 'fujian',
  甘肃: 'gansu',
  广东: 'guangdong',
  广西: 'guangxi',
  贵州: 'guizhou',
  海南: 'hainan',
  河北: 'hebei',
  黑龙江: 'heilongjiang',
  河南: 'henan',
  湖北: 'hubei',
  湖南: 'hunan',
  江苏: 'jiangsu',
  江西: 'jiangxi',
  吉林: 'jilin',
  辽宁: 'liaoning',
  内蒙古: 'neimenggu',
  宁夏: 'ningxia',
  青海: 'qinghai',
  山东: 'shandong',
  上海: 'shanghai',
  山西: 'shanxi',
  四川: 'sichuan',
  台湾: 'taiwan',
  天津: 'tianjin',
  香港: 'xianggang',
  新疆: 'xinjiang',
  西藏: 'xizang',
  云南: 'yunnan',
  浙江: 'zhejiang'
}

export function getProvinceMapInfo (arg) {
  const path = `/static/map/province/${name2pinyin[arg]}.json`
  return {
    key: name2pinyin[arg],
    path: path
  }
}
5 热销商品占比(多个饼图切换)
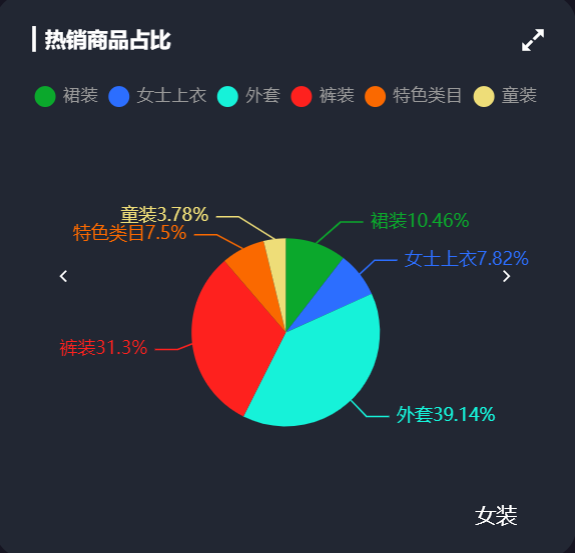
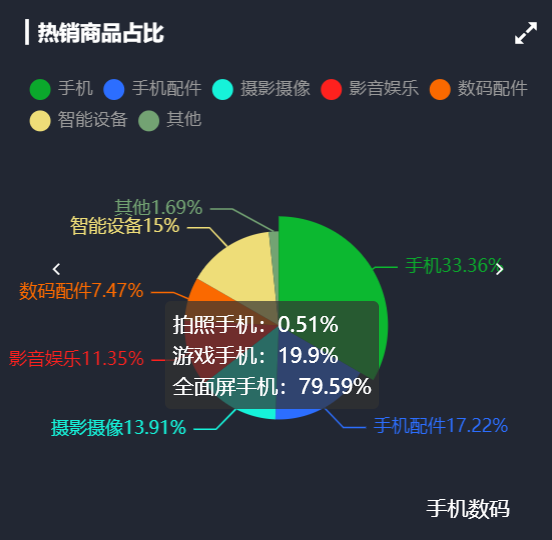
[
  {
    "name": "女装",
    "children": [
      {
        "name": "裙装",
        "value": 56202,
        "children": [
          {
            "name": "套装裙",
            "value": 10281
          },
          {
            "name": "A字裙",
            "value": 22331
          },
          {
            "name": "复古连衣裙",
            "value": 23590
          }
        ]
      },
      {
        "name": "女士上衣",
        "value": 42013,
        "children": [
          {
            "name": "格子衬衫",
            "value": 7896
          },
          {
            "name": "雪纺衫",
            "value": 10422
          },
          {
            "name": "polo衫",
            "value": 23695
          }
        ]
      },
      {
        "name": "外套",
        "value": 210282,
        "children": [
          {
            "name": "牛仔外套",
            "value": 87330
          },
          {
            "name": "针织外套",
            "value": 65770
          },
          {
            "name": "风衣外套",
            "value": 57182
          }
        ]
      },
      {
        "name": "裤装",
        "value": 168203,
        "children": [
          {
            "name": "工装裤",
            "value": 68203
          },
          {
            "name": "阔腿裤",
            "value": 50000
          },
          {
            "name": "牛仔裤",
            "value": 50000
          }
        ]
      },
      {
        "name": "特色类目",
        "value": 40292,
        "children": [
          {
            "name": "大码女装",
            "value": 292
          },
          {
            "name": "旗袍",
            "value": 10000
          },
          {
            "name": "礼服",
            "value": 10000
          }
        ]
      },
      {
        "name": "童装",
        "value": 20313,
        "children": [
          {
            "name": "童衣",
            "value": 5000
          },
          {
            "name": "童裤子",
            "value": 15313
          }
        ]
      }
    ]
  },
  {
    "name": "手机数码",
    "children": [
      {
        "name": "手机",
        "value": 201023,
        "children": [
          {
            "name": "拍照手机",
            "value": 1023
          },
          {
            "name": "游戏手机",
            "value": 40000
          },
          {
            "name": "全面屏手机",
            "value": 160000
          }
        ]
      },
      {
        "name": "手机配件",
        "value": 103735,
        "children": [
          {
            "name": "手机壳",
            "value": 3735
          },
          {
            "name": "手机贴膜",
            "value": 70000
          },
          {
            "name": "创意配件",
            "value": 30000
          }
        ]
      },
      {
        "name": "摄影摄像",
        "value": 83834,
        "children": [
          {
            "name": "单反相机",
            "value": 3834
          },
          {
            "name": "微单",
            "value": 50000
          },
          {
            "name": "镜头",
            "value": 30000
          }
        ]
      },
      {
        "name": "影音娱乐",
        "value": 68384,
        "children": [
          {
            "name": "耳机/耳麦",
            "value": 30000
          },
          {
            "name": "音箱/音响",
            "value": 8384
          },
          {
            "name": "麦克风",
            "value": 30000
          }
        ]
      },
      {
        "name": "数码配件",
        "value": 45038,
        "children": [
          {
            "name": "存储卡",
            "value": 10000
          },
          {
            "name": "三脚架/云台",
            "value": 5038
          },
          {
            "name": "机身附件",
            "value": 30000
          }
        ]
      },
      {
        "name": "智能设备",
        "value": 90382,
        "children": [
          {
            "name": "智能手环",
            "value": 382
          },
          {
            "name": "智能家居",
            "value": 60000
          },
          {
            "name": "无人机",
            "value": 30000
          }
        ]
      },
      {
        "name": "其他",
        "value": 10201,
        "children": [
          {
            "name": "运营商",
            "value": 10000
          },
          {
            "name": "电子教育",
            "value": 201
          }
        ]
      }
    ]
  },
  {
    "name": "美妆护肤",
    "children": [
      {
        "name": "面部护肤",
        "value": 430291,
        "children": [
          {
            "name": "乳液/面霜",
            "value": 30291
          },
          {
            "name": "洁面",
            "value": 100000
          },
          {
            "name": "面膜",
            "value": 300000
          }
        ]
      },
      {
        "name": "彩妆",
        "value": 80284,
        "children": [
          {
            "name": "口红",
            "value": 60284
          },
          {
            "name": "粉底液",
            "value": 10000
          },
          {
            "name": "眉笔/眉粉",
            "value": 10000
          }
        ]
      },
      {
        "name": "男士护肤",
        "value": 40294,
        "children": [
          {
            "name": "洁面",
            "value": 10294
          },
          {
            "name": "剃须",
            "value": 5000
          },
          {
            "name": "护肤套装",
            "value": 25000
          }
        ]
      },
      {
        "name": "美妆工具",
        "value": 50939,
        "children": [
          {
            "name": "化妆棉",
            "value": 10939
          },
          {
            "name": "化妆刷",
            "value": 10000
          },
          {
            "name": "双眼皮贴",
            "value": 30000
          }
        ]
      },
      {
        "name": "其他",
        "value": 10921,
        "children": [
          {
            "name": "香水",
            "value": 921
          },
          {
            "name": "当季主推",
            "value": 10000
          }
        ]
      }
    ]
  }
]
<!-- 热销商品图表 --> <template> <div class='com-container'> <div class='com-chart' ref='hot_ref'></div> <span class="iconfont arr-left" @click="toLeft" :style="comStyle"></span> <span class="iconfont arr-right" @click="toRight" :style="comStyle"></span> <span class="cat-name" :style="comStyle">{{ catName }}</span> </div> </template> <script> import { mapState } from 'vuex' import { getThemeValue } from '@/utils/theme_utils' export default { data () { return { chartInstance: null, allData: null, currentIndex: 0, // 当前所展示出的一级分类数据 titleFontSize: 0 } }, created () { // 在组件创建完成之后 进行回调函数的注册 this.$socket.registerCallBack('hotData', this.getData) }, computed: { catName () { if (!this.allData) { return '' } else { return this.allData[this.currentIndex].name } }, comStyle () { return { fontSize: this.titleFontSize + 'px', color: getThemeValue(this.theme).titleColor } }, ...mapState(['theme']) }, mounted () { this.initChart() // this.getData() this.$socket.send({ action: 'getData', socketType: 'hotData', chartName: 'hot', value: '' }) window.addEventListener('resize', this.screenAdapter) this.screenAdapter() }, destroyed () { window.removeEventListener('resize', this.screenAdapter) this.$socket.unRegisterCallBack('hotData') }, methods: { initChart () { this.chartInstance = this.$echarts.init(this.$refs.hot_ref, this.theme) const initOption = { title: { text: '▎ 热销商品的占比', left: 20, top: 20 }, legend: { top: '15%', icon: 'circle' }, tooltip: { show: true, formatter: arg => { // console.log(arg) const thirdCategory = arg.data.children // 计算出所有三级分类的数值总和 let total = 0 thirdCategory.forEach(item => { total += item.value }) let retStr = '' thirdCategory.forEach(item => { retStr += ` ${item.name}:${parseInt(item.value / total * 100) + '%'} <br/> ` }) return retStr } }, series: [ { type: 'pie', label: { show: false }, emphasis: { label: { show: true }, labelLine: { show: false } } } ] } this.chartInstance.setOption(initOption) }, getData (ret) { // 获取服务器的数据, 对this.allData进行赋值之后, 调用updateChart方法更新图表 // const { data: ret } = await this.$http.get('hotproduct') this.allData = ret console.log(this.allData) this.updateChart() }, updateChart () { // 处理图表需要的数据 const legendData = this.allData[this.currentIndex].children.map(item => { return item.name }) const seriesData = this.allData[this.currentIndex].children.map(item => { return { name: item.name, value: item.value, children: item.children // 新增加children的原因是为了在tooltip中的formatter的回调函数中,来拿到这个二级分类下的三级分类数据 } }) const dataOption = { legend: { data: legendData }, series: [ { data: seriesData } ] } this.chartInstance.setOption(dataOption) }, screenAdapter () { this.titleFontSize = this.$refs.hot_ref.offsetWidth / 100 * 3.6 const adapterOption = { title: { textStyle: { fontSize: this.titleFontSize } }, legend: { itemWidth: this.titleFontSize, itemHeight: this.titleFontSize, itemGap: this.titleFontSize / 2, textStyle: { fontSize: this.titleFontSize / 2 } }, series: [ { radius: this.titleFontSize * 4.5, center: ['50%', '60%'] } ] } this.chartInstance.setOption(adapterOption) this.chartInstance.resize() }, toLeft () { this.currentIndex-- if (this.currentIndex < 0) { this.currentIndex = this.allData.length - 1 } this.updateChart() }, toRight () { this.currentIndex++ if (this.currentIndex > this.allData.length - 1) { this.currentIndex = 0 } this.updateChart() } }, watch: { theme () { console.log('主题切换了') this.chartInstance.dispose() // 销毁当前的图表 this.initChart() // 重新以最新的主题名称初始化图表对象 this.screenAdapter() // 完成屏幕的适配 this.updateChart() // 更新图表的展示 } } } </script> <style lang='less' scoped> .arr-left { position:absolute; left: 10%; top: 50%; transform: translateY(-50%); cursor: pointer; color: white; } .arr-right { position:absolute; right: 10%; top: 50%; transform: translateY(-50%); cursor: pointer; color: white; } .cat-name { position:absolute; left: 80%; bottom: 20px; color: white; } </style>
6 库存与销量分析
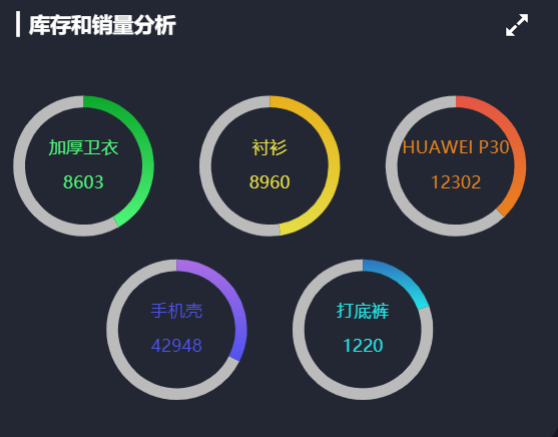
[{
    "name": "IPhone 11",
    "stock": 2310,
    "sales": 2103
}, {
    "name": "长筒靴系带",
    "stock": 34312,
    "sales": 23509
}, {
    "name": "打底毛衣宽松",
    "stock": 22140,
    "sales": 12830
}, {
    "name": "厚款羽绒服",
    "stock": 10842,
    "sales": 5492
}, {
    "name": "牛仔裤",
    "stock": 68102,
    "sales": 44043
}, {
    "name": "加厚卫衣",
    "stock": 12032,
    "sales": 8603
}, {
    "name": "衬衫",
    "stock": 9890,
    "sales": 8960
}, {
    "name": "HUAWEI P30",
    "stock": 20130,
    "sales": 12302
}, {
    "name": "手机壳",
    "stock": 89342,
    "sales": 42948
}, {
    "name": "打底裤",
    "stock": 5034,
    "sales": 1220
}]
<!-- 库存销量分析 -->
<template>
  <div class='com-container'>
    <div class='com-chart' ref='stock_ref'></div>
  </div>
</template>

<script>
import { mapState } from 'vuex'
export default {
  data () {
    return {
      chartInstance: null,
      allData: null,
      currentIndex: 0, // 当前显示的数据
      timerId: null // 定时器的标识
    }
  },
  created () {
    // 在组件创建完成之后 进行回调函数的注册
    this.$socket.registerCallBack('stockData', this.getData)
  },
  mounted () {
    this.initChart()
    // this.getData()
    this.$socket.send({
      action: 'getData',
      socketType: 'stockData',
      chartName: 'stock',
      value: ''
    })
    window.addEventListener('resize', this.screenAdapter)
    this.screenAdapter()
  },
  destroyed () {
    window.removeEventListener('resize', this.screenAdapter)
    clearInterval(this.timerId)
    this.$socket.unRegisterCallBack('stockData')
  },
  methods: {
    initChart () {
      this.chartInstance = this.$echarts.init(this.$refs.stock_ref, this.theme)
      const initOption = {
        title: {
          text: '▎库存和销量分析',
          left: 20,
          top: 20
        }
      }
      this.chartInstance.setOption(initOption)
      this.chartInstance.on('mouseover', () => {
        clearInterval(this.timerId)
      })
      this.chartInstance.on('mouseout', () => {
        this.startInterval()
      })
    },
    getData (ret) {
      // 获取服务器的数据, 对this.allData进行赋值之后, 调用updateChart方法更新图表
      // const { data: ret } = await this.$http.get('stock')
      this.allData = ret
      console.log(this.allData)
      this.updateChart()
      this.startInterval()
    },
    updateChart () {
      const centerArr = [
        ['18%', '40%'],
        ['50%', '40%'],
        ['82%', '40%'],
        ['34%', '75%'],
        ['66%', '75%']
      ]
      const colorArr = [
        ['#4FF778', '#0BA82C'],
        ['#E5DD45', '#E8B11C'],
        ['#E8821C', '#E55445'],
        ['#5052EE', '#AB6EE5'],
        ['#23E5E5', '#2E72BF']
      ]
      // 处理图表需要的数据
      const start = this.currentIndex * 5
      const end = (this.currentIndex + 1) * 5
      const showData = this.allData.slice(start, end)
      const seriesArr = showData.map((item, index) => {
        return {
          type: 'pie',
          center: centerArr[index],
          hoverAnimation: false, // 关闭鼠标移入到饼图时的动画效果
          labelLine: {
            show: false // 隐藏指示线
          },
          label: {
            position: 'center',
            color: colorArr[index][0]
          },
          data: [
            {
              name: item.name + '\n\n' + item.sales,
              value: item.sales,
              itemStyle: {
                color: new this.$echarts.graphic.LinearGradient(0, 1, 0, 0, [
                  {
                    offset: 0,
                    color: colorArr[index][0]
                  },
                  {
                    offset: 1,
                    color: colorArr[index][1]
                  }
                ])
              }
            },
            {
              value: item.stock,
              itemStyle: {
                color: '#333843'
              }
            }
          ]
        }
      })
      const dataOption = {
        series: seriesArr
      }
      this.chartInstance.setOption(dataOption)
    },
    screenAdapter () {
      const titleFontSize = this.$refs.stock_ref.offsetWidth / 100 * 3.6
      const innerRadius = titleFontSize * 2.8
      const outterRadius = innerRadius * 1.125
      const adapterOption = {
        title: {
          textStyle: {
            fontSize: titleFontSize
          }
        },
        series: [
          {
            type: 'pie',
            radius: [outterRadius, innerRadius],
            label: {
              fontSize: titleFontSize / 2
            }
          },
          {
            type: 'pie',
            radius: [outterRadius, innerRadius],
            label: {
              fontSize: titleFontSize / 2
            }
          },
          {
            type: 'pie',
            radius: [outterRadius, innerRadius],
            label: {
              fontSize: titleFontSize / 2
            }
          },
          {
            type: 'pie',
            radius: [outterRadius, innerRadius],
            label: {
              fontSize: titleFontSize / 2
            }
          },
          {
            type: 'pie',
            radius: [outterRadius, innerRadius],
            label: {
              fontSize: titleFontSize / 2
            }
          }
        ]
      }
      this.chartInstance.setOption(adapterOption)
      this.chartInstance.resize()
    },
    startInterval () {
      if (this.timerId) {
        clearInterval(this.timerId)
      }
      this.timerId = setInterval(() => {
        this.currentIndex++
        if (this.currentIndex > 1) {
          this.currentIndex = 0
        }
        this.updateChart() // 在更改完currentIndex之后 , 需要更新界面
      }, 5000)
    }
  },
  computed: {
    ...mapState(['theme'])
  },
  watch: {
    theme () {
      console.log('主题切换了')
      this.chartInstance.dispose() // 销毁当前的图表
      this.initChart() // 重新以最新的主题名称初始化图表对象
      this.screenAdapter() // 完成屏幕的适配
      this.updateChart() // 更新图表的展示
    }
  }
}
</script>

<style lang='less' scoped>
</style>
作者:华王
博客:https://www.cnblogs.com/huahuawang/

 浙公网安备 33010602011771号