
Vue+Echarts(图表可视化)
Vue+Echarts
相关网址
vue网址:https://cn.vuejs.org/v2/guide/
echarts: https://echarts.apache.org/zh/tutorial.html#5%20%E5%88%86%E9%92%9F%E4%B8%8A%E6%89%8B%20ECharts
1.1vue-cli 脚手架安装
在全局环境中安装 vue-cli 脚手架
npm install -g @vue/cli
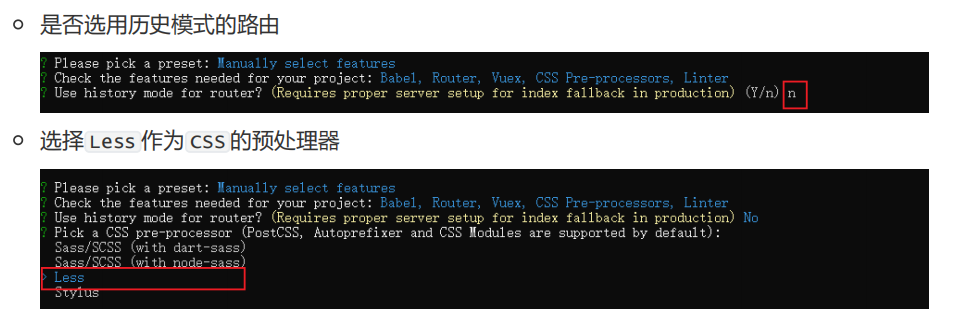
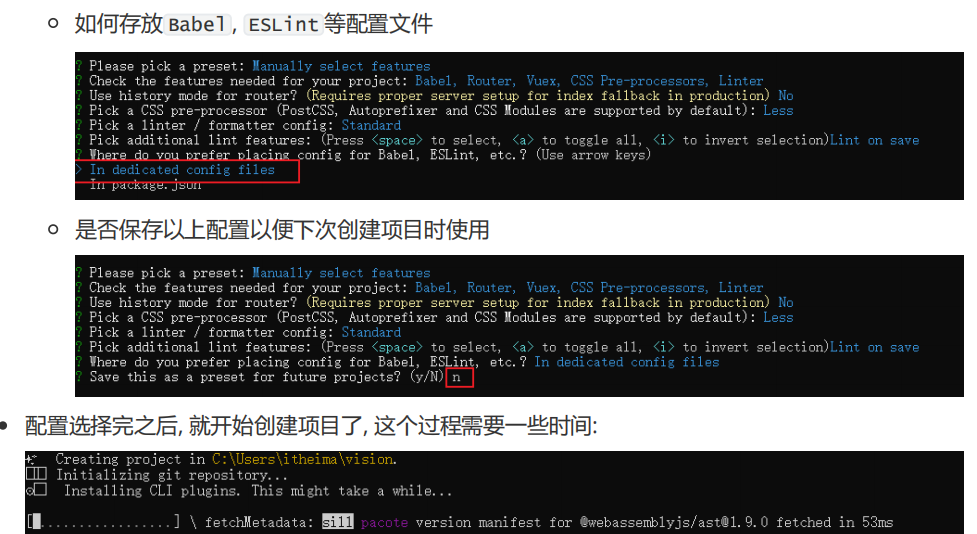
1.2 使用vue创建一个项目
vue create yuqing_front(项目名)
配置:

1.3 运行项目
cd yuqing_front
npm run serve
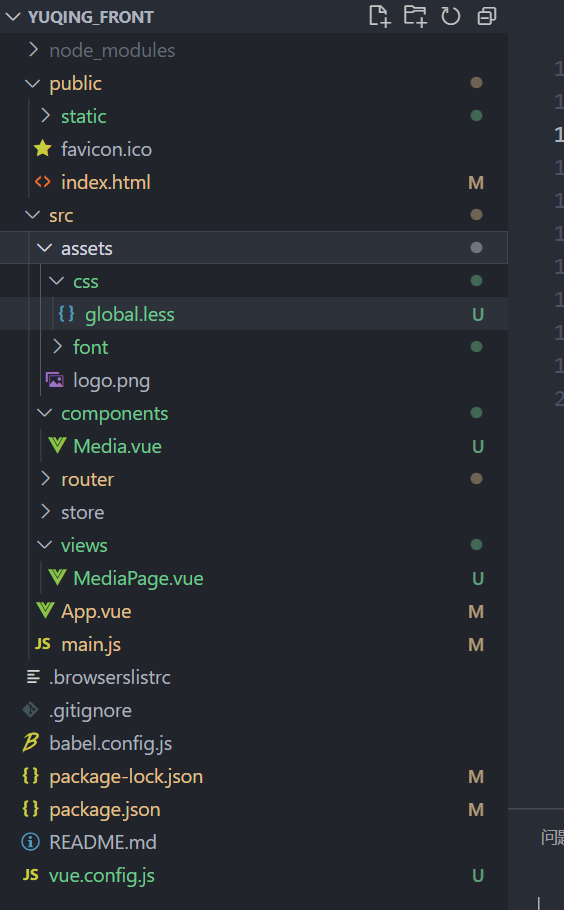
1.4删除无关代码
- 修改 App.vue 中的代码,将布局和样式删除, 变成如下代码
<template>
    <div id="app">
     <router-view/>
     </div>
</template>

<style lang="less">
 </style>
- 删除 components/HelloWorld.vue 这个文件
- 删除 views/About.vue 和 views/Home.vue 这两个文件
- 修改 router/index.js 中的代码,去除路由配置和 Home 组件导入的代码
import Vue from 'vue'
import VueRouter from 'vue-router'
Vue.use(VueRouter)
const routes = []
const router = new VueRouter({
  routes
})
export default router
- 2.1vue.config.js
// 使用vue-cli创建出来的vue工程, Webpack的配置是被隐藏起来了的
// 如果想覆盖Webpack中的默认配置,需要在项目的根路径下增加vue.config.js文件
module.exports={
devServer:{
port :8999, // 端口号的配置
open:true // 自动打开浏览器
}
}
- 2.2 将资料文件夹中的 static 目录复制到 public 目录之下 (相关echart文件)


<!DOCTYPE html>
<html lang="">
  <head>
    <meta charset="utf-8">
    <meta http-equiv="X-UA-Compatible" content="IE=edge">
    <meta name="viewport" content="width=device-width,initial-scale=1.0">
    <link rel="icon" href="<%= BASE_URL %>favicon.ico">
    <title><%= htmlWebpackPlugin.options.title %></title>
  </head>
  <body>
    <noscript>
      <strong>We're sorry but <%= htmlWebpackPlugin.options.title %> doesn't work properly without JavaScript enabled. Please enable it to continue.</strong>
    </noscript>
    <div id="app"></div>
    <!-- built files will be auto injected -->
    <script src="static/lib/echarts.min.js"></script>
    <script src="static/theme/chalk.js"></script>
    <script src="static/theme/vintage.js"></script>
  </body>
</html>
import Vue from 'vue'
import App from './App.vue'
import router from './router'
import store from './store'
// 引入字体的文件
import './assets/font/iconfont.css'
// 引入全局的样式文件
import './assets/css/global.less'
import axios from 'axios'
// 请求基准路径的配置
axios.defaults.baseURL = 'http://127.0.0.1:8888/api/'
// 将axios挂载到Vue的原型对象上
// 在别的组件中 this.$http
Vue.prototype.$http = axios

// 将全局的echarts对象挂载到Vue的原型对象上
// 别的组件中 this.$echarts
Vue.prototype.$echarts = window.echarts

Vue.config.productionTip = false

new Vue({
  router,
  store,
  render: h => h(App)
}).$mount('#app')
html, body, #app {
  width: 100%;
  height: 100%;
  padding: 0;
  margin: 0;
  overflow: hidden;
}

.com-page {
  width: 100%;
  height: 100%;
  overflow: hidden;
}

.com-container {
  width: 100%;
  height: 100%;
  overflow: hidden;
}

.com-chart {
  width: 100%;
  height: 100%;
  overflow: hidden;
}

canvas {
  border-radius: 20px;
}
- 2.3 单独组件开发
--组件结构设计
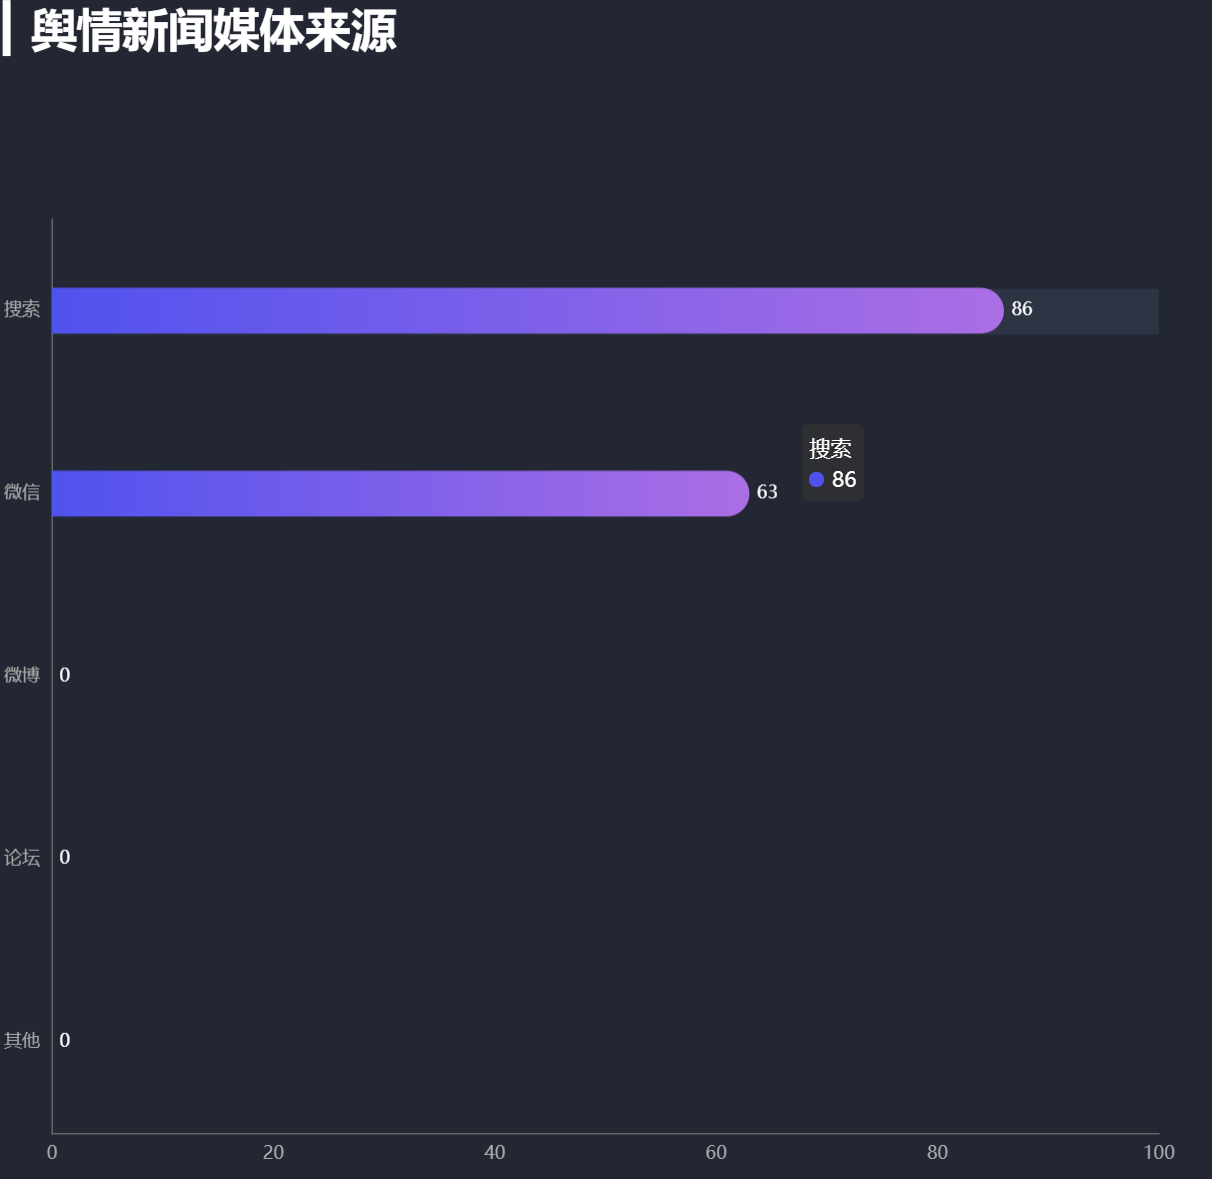
--图表 Media.vue 基本功能的实现
--(分页动画的实现)
--UI 效果调整
--分辨率适配
import Vue from 'vue'
import VueRouter from 'vue-router'


Vue.use(VueRouter)

const routes = [
  {
    path: '/media',
    name: 'media',
    component: () => import('@/views/MediaPage'),
  },
]

const router = new VueRouter({
  routes
})

export default router
<template>
  <div class="com-page">
      <media></media>
  </div>
</template>

<script>
import Media from '@/components/Media.vue'
export default {
  components: { Media },

}
</script>

<style>

</style>
<!-- 商家销量统计的横向柱状图 -->
<template>
  <div class="com-container">
    <div class="com-chart" ref="seller_ref"></div>
  </div>
</template>

<script>
export default {
  data () {
    return {
      chartInstance: null,
      allData: null, // 服务器返回的数据
      currentPage: 1, // 当前显示的页数
      totalPage: 0, // 一共有多少页
      timerId: null // 定时器的标识
    }
  },
  mounted () {
    this.initChart()
    this.getData()
    window.addEventListener('resize', this.screenAdapter)
    // 在页面加载完成的时候, 主动进行屏幕的适配
    this.screenAdapter()
  },
  destroyed () {
    clearInterval(this.timerId)
    // 在组件销毁的时候, 需要将监听器取消掉
    window.removeEventListener('resize', this.screenAdapter)
  },
  methods: {
    // 初始化echartInstance对象
    initChart () {
      this.chartInstance = this.$echarts.init(this.$refs.seller_ref, 'chalk')
      // 对图表初始化配置的控制
      const initOption = {
        title: {
          text: '▎商家销售统计',
          left: 20,
          top: 20
        },
        grid: {
          top: '20%',
          left: '3%',
          right: '6%',
          bottom: '3%',
          containLabel: true // 距离是包含坐标轴上的文字
        },
        xAxis: {
          type: 'value'
        },
        yAxis: {
          type: 'category'
        },
        tooltip: {
          trigger: 'axis',
          axisPointer: {
            type: 'line',
            z: 0,
            lineStyle: {
              color: '#2D3443'
            }
          }
        },
        series: [
          {
            type: 'bar',
            label: {
              show: true,
              position: 'right',
              textStyle: {
                color: 'white'
              }
            },
            itemStyle: {
              // 指明颜色渐变的方向
              // 指明不同百分比之下颜色的值
              color: new this.$echarts.graphic.LinearGradient(0, 0, 1, 0, [
                // 百分之0状态之下的颜色值
                {
                  offset: 0,
                  color: '#5052EE'
                },
                // 百分之100状态之下的颜色值
                {
                  offset: 1,
                  color: '#AB6EE5'
                }
              ])
            }
          }
        ]
      }
      this.chartInstance.setOption(initOption)
      // 对图表对象进行鼠标事件的监听
      this.chartInstance.on('mouseover', () => {
        clearInterval(this.timerId)
      })
      this.chartInstance.on('mouseout', () => {
        this.startInterval()
      })
    },
    // 获取服务器的数据
    async getData () {
      // http://127.0.0.1:8888/api/seller
      const { data: ret } = await this.$http.get('seller')
      this.allData = ret
      // 对数据排序
      this.allData.sort((a, b) => {
        return a.value - b.value // 从小到大的排序
      })
      // 每5个元素显示一页
      this.totalPage = this.allData.length % 5 === 0 ? this.allData.length / 5 : this.allData.length / 5 + 1
      this.updateChart()
      // 启动定时器
      this.startInterval()
    },
    // 更新图表
    updateChart () {
      const start = (this.currentPage - 1) * 5
      const end = this.currentPage * 5
      const showData = this.allData.slice(start, end)
      const sellerNames = showData.map((item) => {
        return item.name
      })
      const sellerValues = showData.map((item) => {
        return item.value
      })
      const dataOption = {
        yAxis: {
          data: sellerNames
        },
        series: [
          {
            data: sellerValues
          }
        ]
      }
      this.chartInstance.setOption(dataOption)
    },
    startInterval () {
      if (this.timerId) {
        clearInterval(this.timerId)
      }
      this.timerId = setInterval(() => {
        this.currentPage++
        if (this.currentPage > this.totalPage) {
          this.currentPage = 1
        }
        this.updateChart()
      }, 3000)
    },
    // 当浏览器的大小发生变化的时候, 会调用的方法, 来完成屏幕的适配
    screenAdapter () {
      // console.log(this.$refs.seller_ref.offsetWidth)
      const titleFontSize = this.$refs.seller_ref.offsetWidth / 100 * 3.6
      // 和分辨率大小相关的配置项
      const adapterOption = {
        title: {
          textStyle: {
            fontSize: titleFontSize
          }
        },
        tooltip: {
          axisPointer: {
            lineStyle: {
              width: titleFontSize
            }
          }
        },
        series: [
          {
            barWidth: titleFontSize,
            itemStyle: {
              barBorderRadius: [0, titleFontSize / 2, titleFontSize / 2, 0]
            }
          }
        ]
      }
      this.chartInstance.setOption(adapterOption)
      // 手动的调用图表对象的resize 才能产生效果
      this.chartInstance.resize()
    }
  }
}
</script>

<style lang="less" scoped>
</style>
作者:华王
博客:https://www.cnblogs.com/huahuawang/

 浙公网安备 33010602011771号