
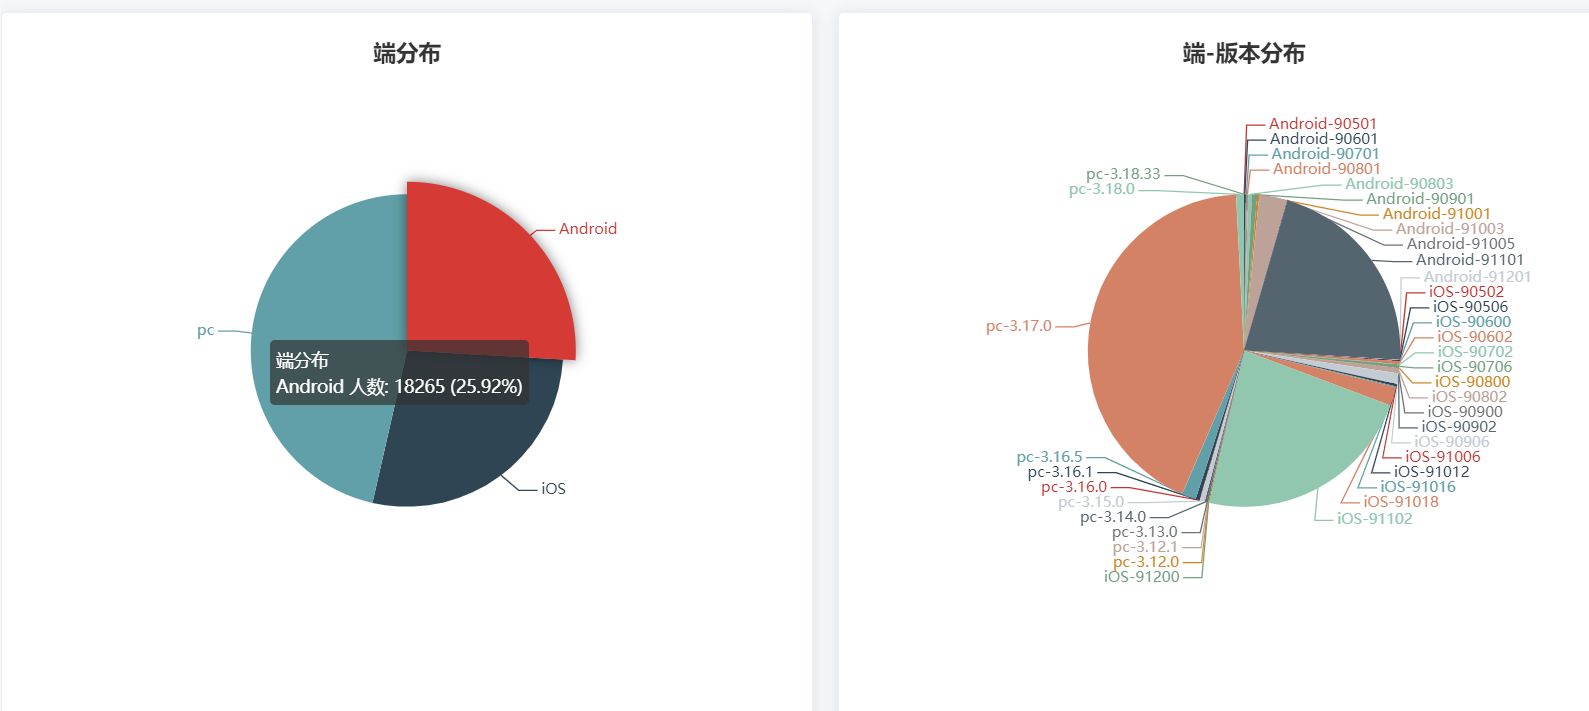
今天记录下echarts做饼图
父组件
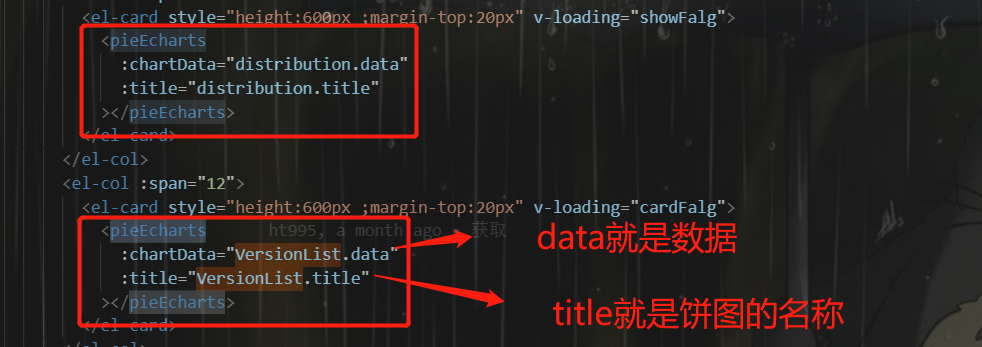
<el-card style="height:600px ;margin-top:20px" v-loading="cardFalg"> <pieEcharts :chartData="VersionList.data" :title="VersionList.title" ></pieEcharts> </el-card>
components: {
pieEcharts
},
上面是dom部分 和引入dom组件
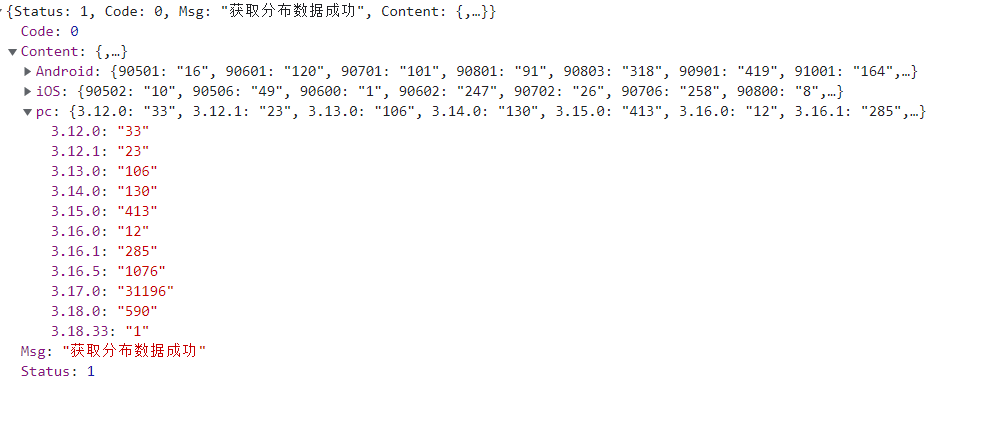
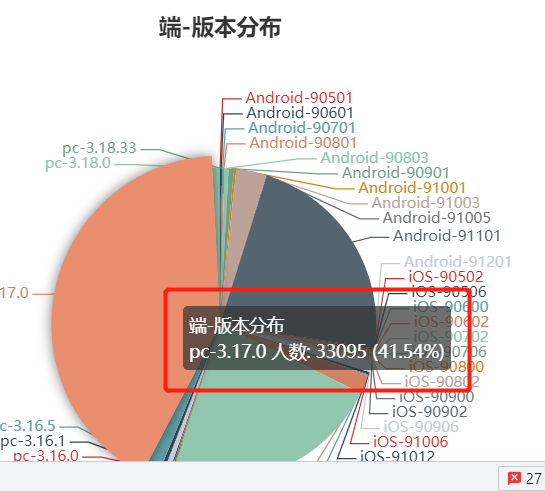
VersionList: { title: '端-版本分布', data: [] } 上面这部分是data里面定义的数据 下面就是请求到的数据 .then(res => { if (res.Status == 1) { const AndroidList = Object.keys(res.Content.Android).map(item => { return { name: `Android-${item}`, value: res.Content.Android[item] } }) const iOSList = Object.keys(res.Content.iOS).map(item => { return { name: `iOS-${item}`, value: res.Content.iOS[item] } }) const pcList = Object.keys(res.Content.pc).map(item => { return { name: `pc-${item}`, value: res.Content.pc[item] } }) this.VersionList.data = [...AndroidList, ...iOSList, ...pcList] } this.cardFalg = false })
随后跟大家看下返回数据的list
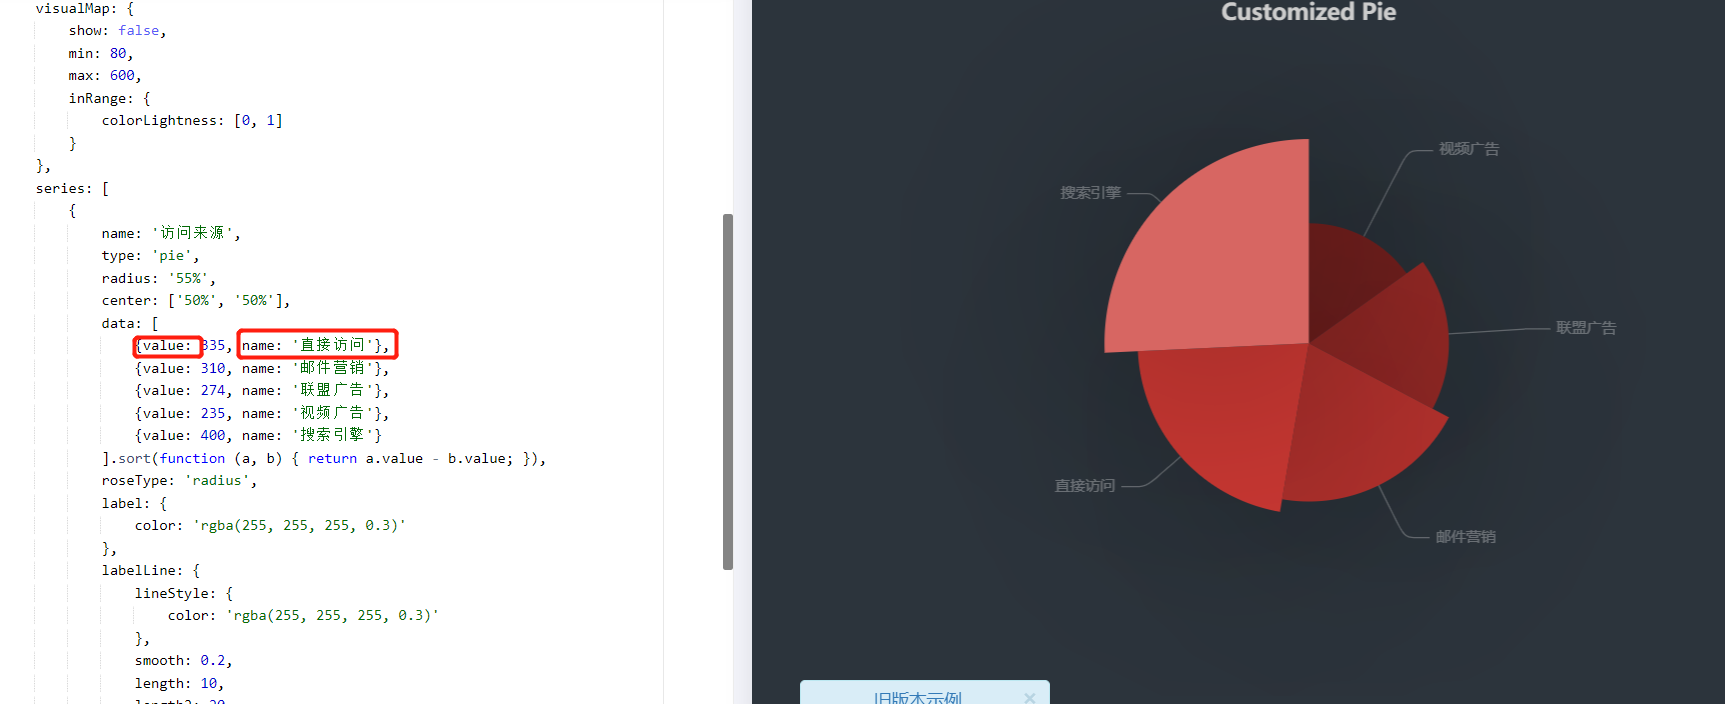
我们打印下Versionlist.data合成的数据格式为什么是name和value必须这样的格式 因为echarts官网的数据格式就是这样 不然数据无法取用
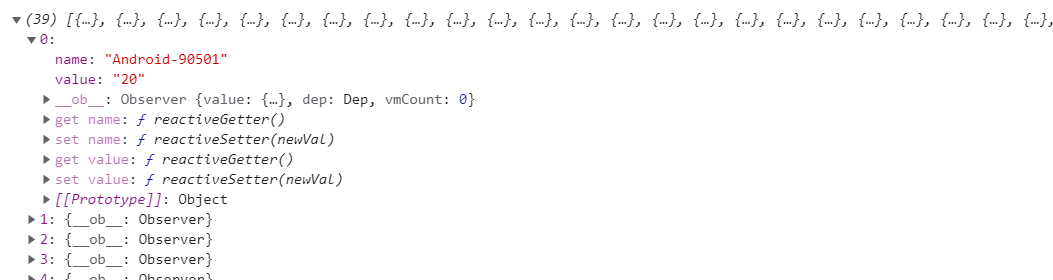
我们看下echarts官网的数据格式例子
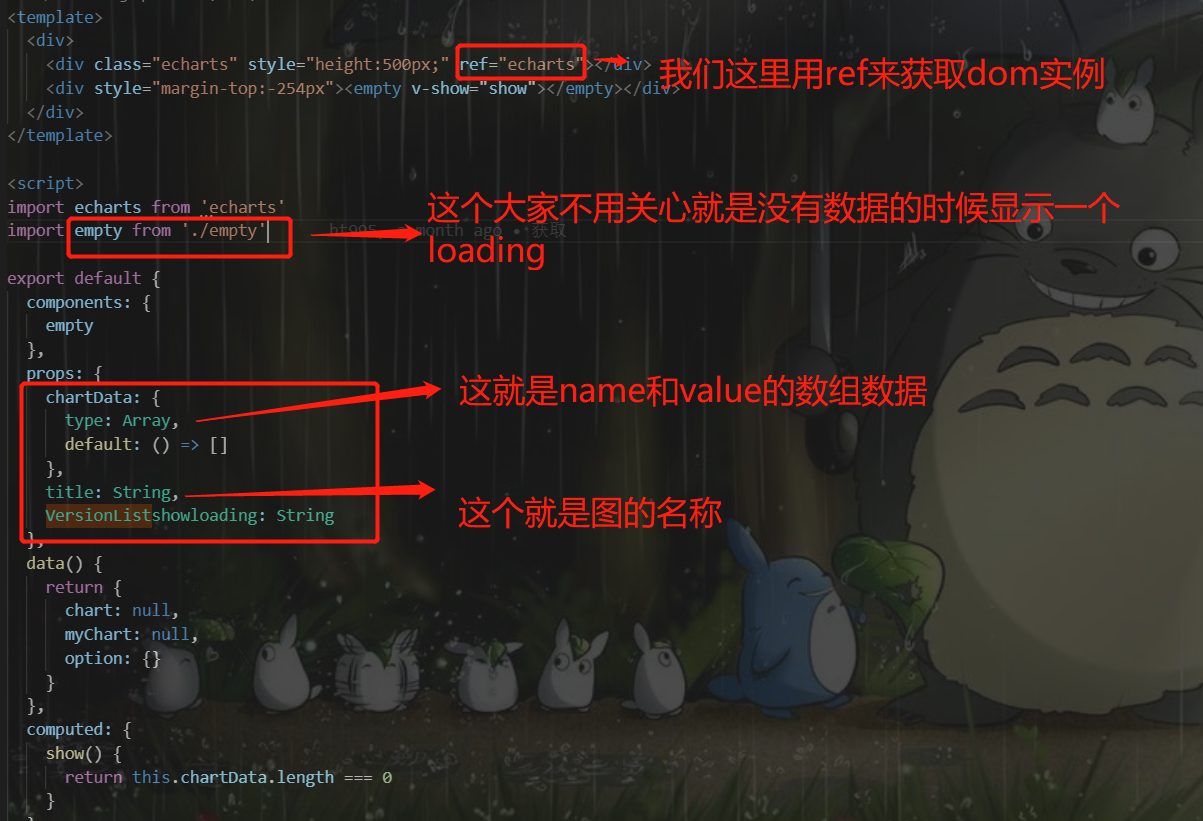
我们再看一下子组件echarts实例的组件代码一次性贴完
<template>
  <div>
    <div class="echarts" style="height:500px;" ref="echarts"></div>
    <div style="margin-top:-254px"><empty v-show="show"></empty></div>
  </div>
</template>

<script>
import echarts from 'echarts'
import empty from './empty'

export default {
  components: {
    empty
  },
  props: {
    chartData: {
      type: Array,
      default: () => []
    },
    title: String,
    VersionListshowloading: String
  },
  data() {
    return {
      chart: null,
      myChart: null,
      option: {}
    }
  },
  computed: {
    show() {
      return this.chartData.length === 0
    }
  },
  watch: {
    chartData(newV, oldV) {
      if (newV.length > 0) {
        this.draw()
      }
    }
  },
  methods: {
    draw() {
      this.myChart = null
      this.chart = this.$refs.echarts
      this.chart.style.height = 500 + 'px'
      this.myChart = echarts.init(this.chart)
      this.option = {
        title: {
          text: this.title,
          left: 'center'
        },
        tooltip: {
          trigger: 'item',
          formatter: this.VersionListshowloading
            ? '{a} <br/>{b} : {c} ({d}%)'
            : '{a} <br/>{b} 人数: {c} ({d}%)'
        },
        series: [
          {
            name: this.title,
            type: 'pie',
            radius: '50%',
            data: this.chartData,
            emphasis: {
              itemStyle: {
                shadowBlur: 10,
                shadowOffsetX: 0,
                shadowColor: 'rgba(0, 0, 0, 0.5)'
              }
            }
          }
        ]
      }
      this.myChart.setOption(this.option)
      this.$nextTick(() => {
        window.addEventListener('resize', () => {
          this.myChart.resize()
        })
      })
    }
  }
}
</script>

<style lang="scss" scoped></style>
贴图跟大家解释吧

下面还有几句就不用解释了 大家应该都懂
看下tooltip
右侧赞助一下 代码改变世界一块二块也是爱

 浙公网安备 33010602011771号