

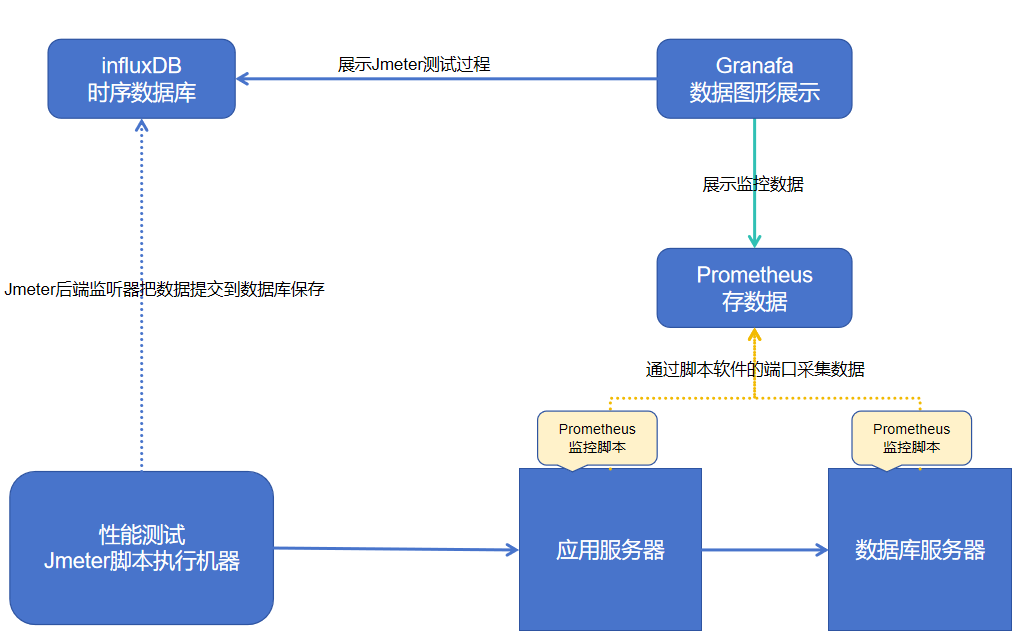
prometheus性能测试监控体系搭建
架构图:
一、InfluxDB 1.8.0 安装
1、下载1.8.0版本deb包
wget https://dl.influxdata.com/influxdb/releases/influxdb_1.8.0_amd64.deb
2、安装deb包
sudo dpkg -i influxdb_1.8.0_amd64.deb

3、启动并验证influxDB
1)启动服务并设置开机自启
# 启动服务
sudo systemctl start influxdb
# 设置开机自启
sudo systemctl enable influxdb
2)验证服务状态
sudo systemctl status influxdb

3)验证版本:
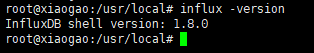
默认端口:8086
二、Grafana 9.0.0安装
1、下载deb包
wget https://dl.grafana.com/oss/release/grafana_9.0.0_amd64.deb
2、安装deb包
sudo dpkg -i grafana_9.0.0_amd64.deb
3、启动并验证
1)启动服务开机自启
# 启动Grafana服务
sudo systemctl start grafana-server
# 设置开机自启
sudo systemctl enable grafana-server
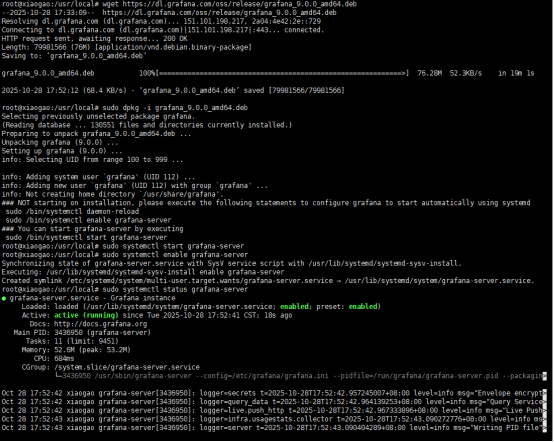
2)验证服务状态
sudo systemctl status grafana-server
3)验证版本
root@xiaogao:/usr/local# grafana-server -v
Version 9.0.0 (commit: b5c56f6371, branch: HEAD)
4、访问Grafana界面:
(1) 默认使用 3000 端口
(2) 初始用户名和密码:admin/admin
(3) 浏览器访问:http://<服务器IP或localhost>:3000
三、Prometheus 2.36.1 安装
1、安装包下载,上传到服务器
2、解压缩
tar xvfz prometheus-2.36.1.linux-amd64.tar.gz
3、解压缩后的目录结构
console_libraries
consoles
LICENSE
NOTICE
prometheus -- 启动文件
prometheus.yml -- 配置文件
promtool
4、后台启动
cd prometheus-2.36.1.linux-amd64
nohup ./prometheus --config.file=prometheus.yml > prom.log 2>&1 &
5、访问:http://<服务器IP或localhost>:9090
四、
tar -xvf node_exporter-1.3.1.linux-amd64.tar.gz
cd node_exporter-1.3.1.linux-amd64
3、启动
nohup ./node_exporter > node_exporter.log 2>&1 &
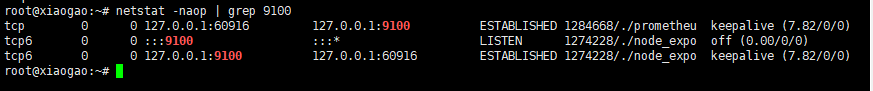
4、检查默认端口 9100
五、Prometheus服务器配置
# 全局配置
global:
  scrape_interval: 15s # 设置抓取间隔,默认1分钟,配置是15秒
  evaluation_interval: 15s # 估算规则的默认周期,默认1分钟,配置是15秒
  # scrape_timeout # 抓取超时时间,默认10秒
# Alertmanager configuration
alerting:
  alertmanagers:
    - static_configs:
        - targets:
          # - alertmanager:9093
# 规则文件列表,使用  evaluation_interval 间隔去抓取
rule_files:
  # - "first_rules.yml"
  # - "second_rules.yml"
# 抓取节点配置,使用 scrape_interval 间隔去抓取
scrape_configs:
  # prometheus默认的节点配置
  - job_name: "prometheus"
    # metrics_path defaults to '/metrics'
    # scheme defaults to 'http'.
    static_configs:
      - targets: \["localhost:9091"\]
说明:将node_exporter集成到Prometheus配置中,告诉Prometheus将采集localhost:9100的数据,确保数据能够正常采集。
六、配置Jmeter的后端监听器
1、后端监听器
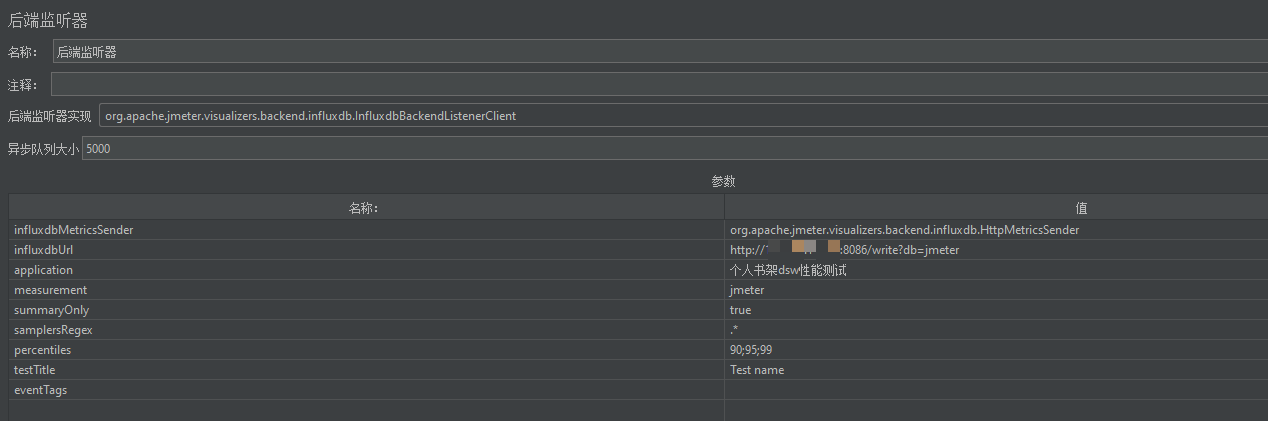
配置的influxdbUrl 为 安装时序数据库的 服务器ip 和 端口(8086)
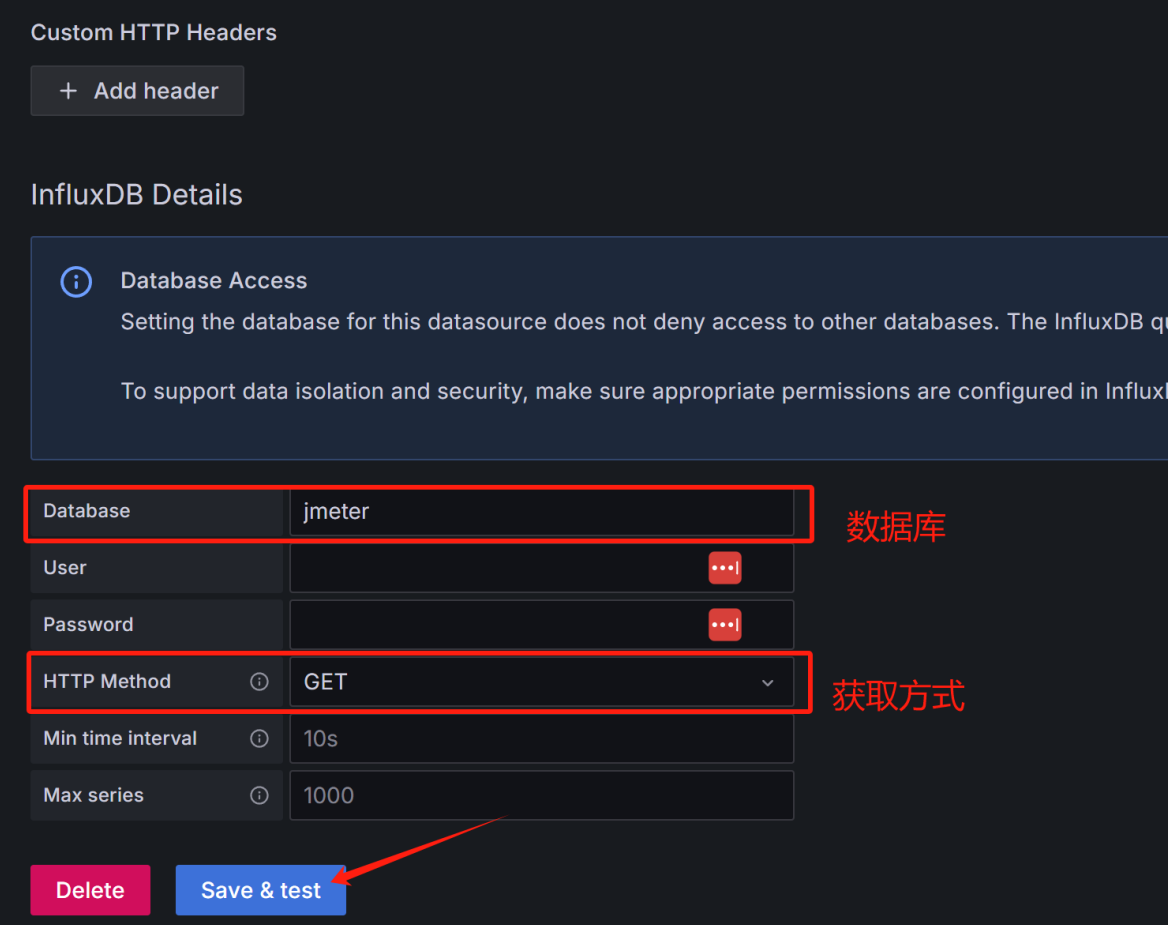
2、influxdb创建数据库
influx
CREATE DATABASE jmeter
quit
说明:
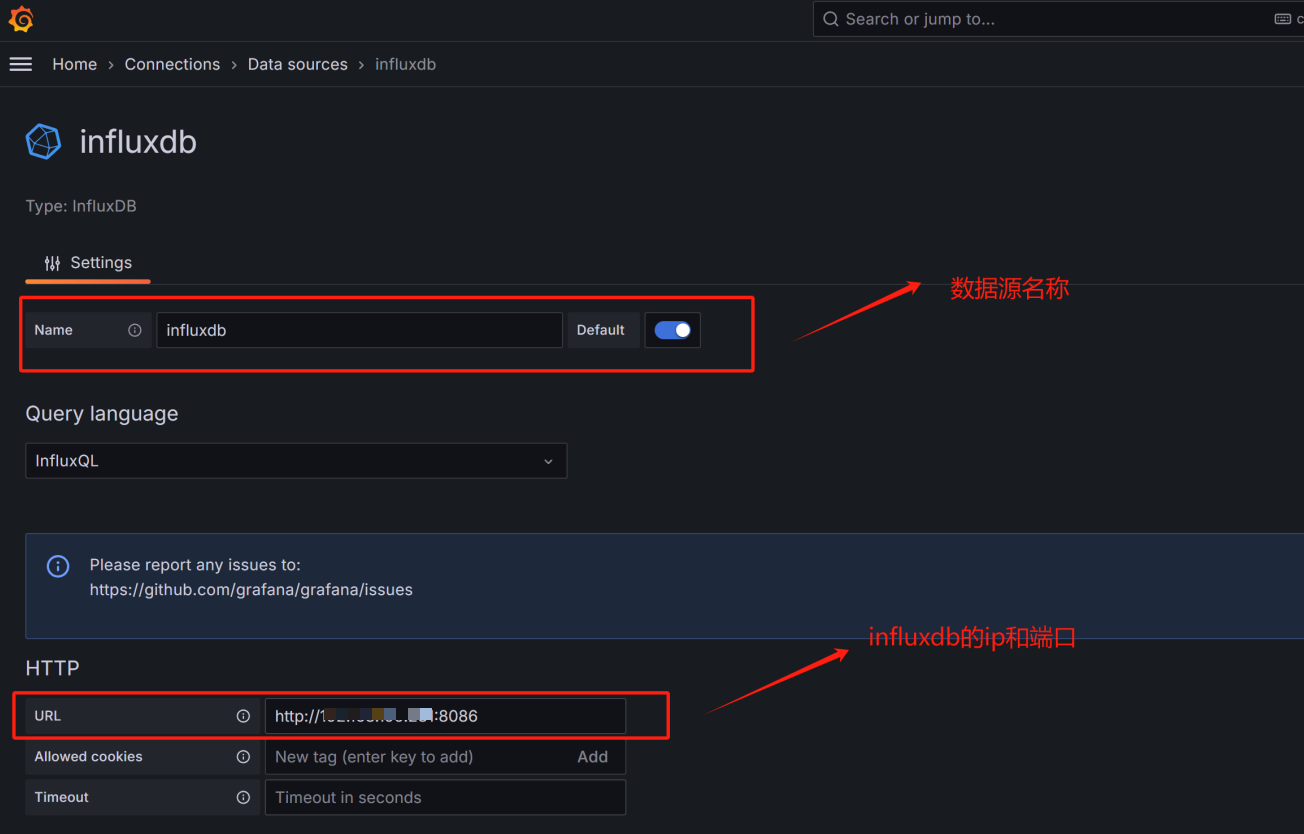
六、配置Granafa大屏
1、添加数据源
2、下载模板:json模板
https://grafana.com/api/dashboards/5496/verisions/1/download
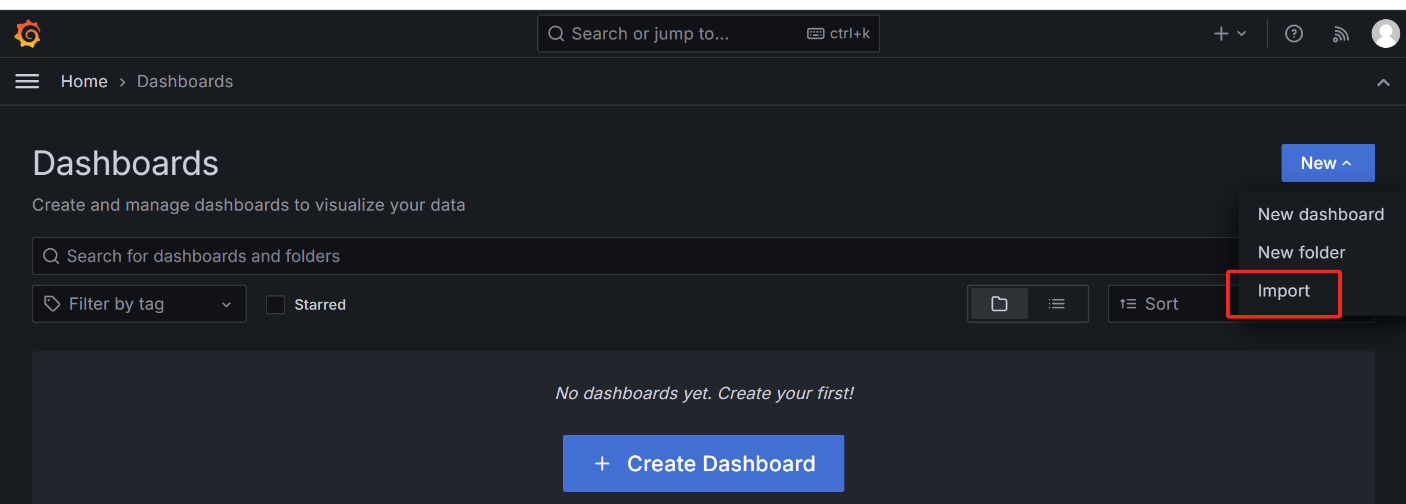
3、导入json看板
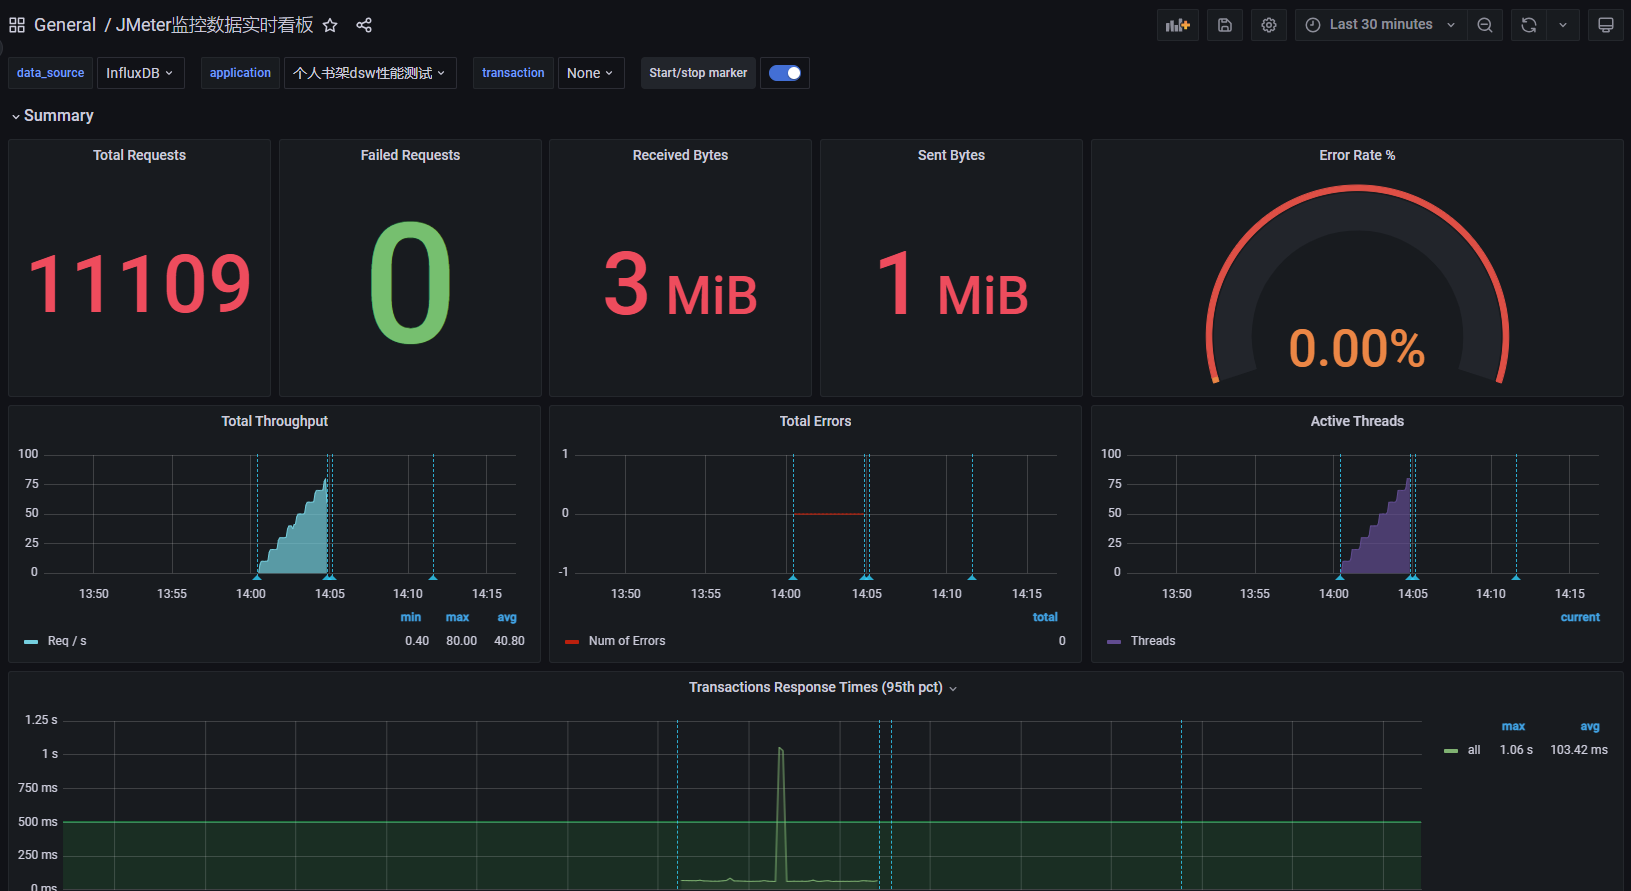
七、大屏效果和实时数据展示

 浙公网安备 33010602011771号