echart 图表实现
import { CSSProperties, useEffect, useState } from 'react';
import * as echarts from 'echarts';
import Chart from '@/pages/components/Charts';
import { EChartsCoreOption } from 'echarts';
import ChartTitle from '../components/ChartTitle/chartTitle';
/**
* @description 给echart子组件公用借口
* @options echarts options配置与内部defaultOption合并 <a href='https://echarts.apache.org/zh/option.html#title'>点击跳转</>
* @seriesOptions 用于echart与内部seriesOption合并 <a href='https://echarts.apache.org/zh/option.html#series'>点击跳转</>
* @data series数据层
* @titleConfig 搭配tableList组件配置
* @style 父级元素的style样式
* @colors ehcart颜色
*/
interface EchartProps {
options?: EChartsCoreOption;
titleConfig?: any;
style?: CSSProperties;
data: Array<any>;
colors?: Array<any>
seriesOptions?: any
}
export default ({options, data, colors, titleConfig, style}: EchartProps) => {
const [lineOptions, setBarOptions] = useState<EChartsCoreOption | null>(null);
let defaultSeries: any = data.map((item,index) => {
let [c1, c2] = item.gradientColor;
return {
name: item.name,
type: 'line',
smooth: true, //是否平滑
symbolSize: 8,
showAllSymbol: true,
showSymbol: false, // 只有在 tooltip hover 的时候显示。
symbol: 'circle', //折线点设置为实心点
label: {
show: true,
position: 'left',
textStyle: {
color: c1,
fontSize: 20,
}
},
itemStyle: {
color: c1,
borderColor: "#fff",
borderWidth: 2,
shadowColor: "rgba(0, 0, 0, .3)",
shadowBlur: 0,
shadowOffsetY: 2,
shadowOffsetX: 2,
},
areaStyle: {
normal: {
color: new echarts.graphic.LinearGradient(
0,
0,
0,
1,
[
{
offset: 0,
color: c2,
},
{
offset: 1,
color: c1,
},
],
false
),
},
},
color: c1,
data: item.data,
};
});
useEffect(() => {
let defalutOptions: EChartsCoreOption;
defalutOptions = {
tooltip: {
trigger: 'axis',
showContent: false, // 是否显示提示框浮层,默认显示。
axisPointer: {
lineStyle: {
color: '#fff',
width: 2,
type: 'soild',
shadowColor: 'rgba(255, 255, 255, 0.5)',
shadowBlur: 100,
shadowOffsetX: 10
},
},
},
legend: {
orient: 'horizontal', // 水平
top: 30,
right: 90,
align: 'right',
itemWidth: 16,
itemHeight: 16,
borderWidth: 0,
icon: 'roundRect',
textStyle: {
fontSize: 14,
color: '#ddd',
fontFamily: 'PingFangSC-Regular',
fontWeight: 400,
},
},
grid: {
// top: '5%',
// left: '5%',
// right: '15%',
// bottom: '15%',
containLabel: true
},
xAxis: {
type: 'category',
boundaryGap: false,
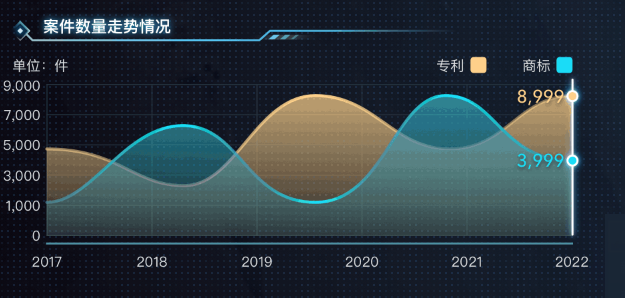
data: ['202101', '202102', '202103', '202104', '202105', '202106'],
axisLine: {
onZero: false,
minInterval: 1,
lineStyle: {
type: 'solid',
color: '#4E91A3',
width: 2,
shadowColor: 'rgba(0, 0, 0, 0.5)',
shadowBlur: 10,
},
},
axisTick: {
show: false,
},
offset: 5,
axisLabel: {
color: '#ccc',
},
splitLine: {
show: true,
lineStyle: {
color: ['#22343C'],
width: 1,
type: 'dashed',
},
},
},
yAxis: {
type: 'value',
axisLabel: {
show: true,
interval: 0,
textStyle: {
baseline: 'middle',
color: '#ccc',
},
},
axisLine: {
minInterval: 1,
lineStyle: {
type: 'solid',
color: '#ccc',
with: 1,
},
},
splitLine: {
show: true,
lineStyle: {
color: ['#22343C'],
width: 1,
type: 'dashed',
},
},
},
series: defaultSeries
};
if(options){
defalutOptions = Object.assign(defalutOptions,options)
}
setBarOptions(defalutOptions);
}, [options]);
return (
<div style={{ display: 'flex', flexDirection: 'column' }}>
{titleConfig && Object.keys(titleConfig).length ? (
<ChartTitle
title={titleConfig.title}
typeClass={titleConfig.typeClass}
/>
) : null}
<Chart
options={lineOptions}
height={style?.height || 430}
width={style?.width || 960}
/>
</div>
);
};

// 玫瑰图
import * as echarts from 'echarts';
import { echarOptsMerge } from '../utils';
import { EChartsCoreOption } from 'echarts';
/**
 * @options  echarts options配置与内部defaultOption合并 <a href='https://echarts.apache.org/zh/option.html#title'>点击跳转</>
 * @data   series数据层
 * @titleConfig 搭配tableList组件配置
 * @style  父级元素的style样式
 */
interface IEchartProps {
  options?: EChartsCoreOption;
  data: {
    name: string;
    value: Array<number>;
  };
}

export default ({ options, data }: IEchartProps) => {
  // 根据传入的数据获取最大值范围
  let max = data.value[0];
  let maxlen: any = max.toString().length;
  let baseOptions: EChartsCoreOption = {
    angleAxis: {
      max: '1'.padEnd(maxlen + 1, '0'),
      clockwise: false,
      show: false,
    },
    animation: false,
    radiusAxis: {
      type: 'category',
      show: true,
      axisLabel: {
        show: false,
      },
      axisLine: {
        show: false,
      },
      axisTick: {
        show: false,
      },
    },
    polar: [
      {
        center: ['50%', '50%'], //中心点位置
        radius: ['50%', '70%'],
      },
    ],
    series: [
      {
        stack: '外层圆环',
        type: 'bar',
        data: data.value,
        showBackground: false,
        coordinateSystem: 'polar',
        barWidth: 50,
        silent: true,
        zlevel: 3,
        itemStyle: {
          color: new echarts.graphic.LinearGradient(0, 0, 0, 1, [
            {
              offset: 1,
              color: '#56FDFF',
            },
            {
              offset: 0,
              color: '#06BDBF',
            },
          ]),
          shadowColor: 'rgba(255,255,255,.8)',
          shadowBlur: 20,
          shadowOffsetX: 0,
          shadowOffsetY: 0,
        },
      },
      {
        type: 'pie',
        name: '内层细圆环',
        center: ['40%', '50%'],
        radius: ['50%', '60%'],
        hoverAnimation: false,
        clockWise: true,
        itemStyle: {
          color: '#FFD18A',
          shadowColor: 'rgba(255,255,255,.6)',
          shadowBlur: 13,
          shadowOffsetX: 0,
          shadowOffsetY: 0,
        },
        tooltip: {
          show: false,
        },
        label: {
          formatter: data.name,
          position: 'center',
          show: true,
          textStyle: {
            fontSize: 15,
            fontWeight: 'normal',
            color: '#fff',
          },
        },
        data: [100],
      },
    ],
  };

  if (options) {
    baseOptions = Object.assign(baseOptions, options);
  }

  return baseOptions;
};
// 饼图
import { EChartsCoreOption } from 'echarts';
import { echartsOpts } from './echarts.d';
import * as echarts from 'echarts';

export default ({ options, data, config }: echartsOpts) => {
  let color = options?.color || [
    '#4D8BE8',
    '#1785D6',
    '#A4F2EE',
    '#80EFFF',
    '#5FD1EB',
    '#F5855F',
    '#C099FC',
    '#FFA940',
    '#F8AEA4',
  ];
  let formatter =
    options?.formatter ||
    function (e: any) {
      let {
        data: { value = '', name = '', percent = '' },
      } = e;
      return `{border|}{top| ${percent}} \n {center|${value}} \n {bottom|${name}}`;
    };

  let seriesData: any = [];
  // 算出总数,插入间距
  let sum: any = data.reduce((prev, cur) => prev + cur.value, 0);
  const gap = Math.round((1 * sum) / 150);
  data.map((item, index) => {
    seriesData.push(
      {
        itemStyle: {
          normal: {
            //外环发光
            borderWidth: 0.5,
            shadowBlur: 10,
            // @ts-ignore
            borderColor: color[index],
            // @ts-ignore
            shadowColor: color[index],
          },
        },
        ...item,
      },
      {
        value: gap,
        name: '',
        label: {
          show: false,
        },
        itemStyle: {
          normal: {
            color: 'rgba(0, 0, 0, 0)',
            borderColor: 'rgba(0, 0, 0, 0)',
            borderWidth: 0,
          },
        },
      },
    );
  });

  let baseOptions: EChartsCoreOption = {
    legend: {
      show: false,
    },
    color,
    label: {
      formatter,
      minMargin: 2,
      lineHeight: 15,
      rich: {
        border: {
          width: 4,
          height: 30,
          backgroundColor: 'inherit',
          shadowBlur: 18,
          shadowColor: 'rgba(255,255,255.2)',
          borderRadius: 5,
          verticalAlign: 'top',
        },
        top: {
          fontSize: 12,
          color: '#fff',
          align: 'left',
          width: '120%',
          verticalAlign: 'top',
          padding: [0, 0, 0, 3],
        },
        center: {
          fontSize: 18,
          width: '120%',
          align: 'left',
          color: '#fff',
          verticalAlign: 'top',
          padding: [0, 0, 0, 3],
        },
        bottom: {
          fontSize: 12,
          width: '120%',
          align: 'left',
          color: '#fff',
          verticalAlign: 'bottom',
          padding: [0, 0, 0, 3],
        },
      },
    },
    series: [
      {
        name: '饼图',
        type: 'pie',
        radius: ['20%', '40%'],
        labelLine: {
          lineStyle: {
            // color: new echarts.graphic.LinearGradient(0, 0, 0, 1, [
            //   {
            //     offset: 0,
            //     color: "rgba(255, 255, 255,0.7)",
            //   },
            //   {
            //     offset: 1,
            //     color: "rgba(255, 255, 255,0.4)",
            //   },
            // ]),
            width: 2,
          },
        },
        data: seriesData,
      },
      {
        name: '左侧线',
        type: 'custom',
        coordinateSystem: 'none',
        renderItem: function (params: any, api: any) {
          return {
            type: 'arc',
            shape: {
              cx: api.getWidth() / 2,
              cy: api.getHeight() / 2,
              r: (Math.min(api.getWidth(), api.getHeight()) / 2) * 0.43, // 180,
              startAngle: (150 * Math.PI) / 360,
              endAngle: (300 * Math.PI) / 180,
            },
            style: {
              stroke: new echarts.graphic.LinearGradient(0, 0, 0, 1, [
                {
                  offset: 0,
                  color: 'rgba(255,234,190,0)',
                },
                {
                  offset: 0.3,
                  color: 'rgba(255,209,138,.5)',
                },
                {
                  offset: 1,
                  color: 'rgba(255,234,190,0)',
                },
              ]),
              fill: 'transparent',
              lineWidth: 2,
              shadowBlur: 10,
              shadowOffsetX: 10,
              shadowOffsetY: 10,
            },
            silent: true,
          };
        },
        data: [0],
      },
      {
        name: '右侧侧线',
        type: 'custom',
        coordinateSystem: 'none',
        renderItem: function (params: any, api: any) {
          return {
            type: 'arc',
            shape: {
              cx: api.getWidth() / 2,
              cy: api.getHeight() / 2,
              r: (Math.min(api.getWidth(), api.getHeight()) / 2) * 0.46, // 180,
              startAngle: (-130 * Math.PI) / 360,
              endAngle: (150 * Math.PI) / 360,
            },
            style: {
              stroke: new echarts.graphic.LinearGradient(0, 0, 0, 1, [
                {
                  offset: 0,
                  color: 'rgba(255,234,190,0)',
                },
                {
                  offset: 0.3,
                  color: 'rgba(0,255,255,.5)',
                },
                {
                  offset: 1,
                  color: 'rgba(255,234,190,0)',
                },
              ]),
              fill: 'transparent',
              lineWidth: 2,
              shadowBlur: 10,
              shadowOffsetX: 10,
              shadowOffsetY: 10,
            },
            silent: true,
          };
        },
        data: [0],
      },
    ],
  };

  if (options) {
    baseOptions = Object.assign(baseOptions, options);
  }
  return baseOptions;
};

import { echarOptsMerge } from '../utils';
import { EChartsCoreOption } from 'echarts';
import { echartsOpts } from './echarts.d';

export default ({ options, data, config }: echartsOpts) => {
  const baseOptions: EChartsCoreOption = {
    title: {
        subtext: '单位:家',
        right: 0,
        top: 15,
        subtextStyle: {
          color: '#DDDDDD',
        },
      },
      grid: {
        left: '3%',
        right: '4%',
        bottom: '0%',
      },
      legend: {
        top: 20,
        left: 0,
        align: 'right',
        itemWidth: 15,
        itemHeight: 15,
        borderWidth: 0,
        icon: 'roundRect',
      },
      tooltip: {
        show: false,
      },
      xAxis: {
        type: 'value',
        axisLabel: {
          show: false,
        },
      },
    yAxis: {
      nameTextStyle: {
        fontSize: 14,
        color: '#ddd',
        fontFamily: 'PingFangSC-Regular',
        fontWeight: 400,
      },
      axisTick: {
        show: false,
      },
      axisLabel: {
        show: true,
        interval: 0,
        textStyle: {
          baseline: 'middle',
          color: '#ccc',
        },
      },
      axisLine: {
        show: false,
        minInterval: 1,
        lineStyle: {
          type: 'solid',
          color: '#ccc',
          with: 1,
        },
      },
      splitLine: {
        show: true,
        lineStyle: {
          color: ['#22343C'],
          width: 1,
          type: 'dashed',
        },
      },
    },
    series: data.map((item) => {
      let [c1, c2] = item.borderColor;
      return {
        type: 'bar',
        name: item.name,
        data: item.data,
        barWidth: item.barWidth,
        itemStyle: {
          barBorderRadius: item.barBorderRadius || [4, 4, 0, 0],
          borderWidth: 2,
          borderType: 'solid',
          color: item.color,
          shadowBlur: item.shadowBlur || 10,
          shadowOffsetX: item.shadowOffsetX || 0,
          shadowOffsetY: item.shadowOffsetY || 0,
          shadowColor: c2,
          borderColor: {
            type: 'linear',
            x: 0,
            y: 0,
            x2: 0,
            y2: 1,
            ...item.borderColorPosition,
            colorStops: [
              {
                offset: 0,
                color: c1, // 0% 处的颜色
              },
              {
                offset: 1,
                color: c2, // 100% 处的颜色
              },
            ],
            global: false, // 缺省为 false
          },
        },
        label: {
          show: true,
          color: '#fff' || item.labelColor,
          textShadowColor: 'rgba(54,186,255,0.96)',
          textShadowBlur: 8,
          fontWeight: 600,
          fontSize: 14,
          position: item.labelPosition || 'top',
        },
      };
    }),
  };

 if (options) {
    baseOptions = Object.assign(baseOptions, options);
  }

  return baseOptions;
};
传入数据
// 区域对比图
  const [areaOption, setAreaOption] = useState<EChartsCoreOption | null>(null);
  const getAreaData: Array<IAreaData> = [
    {
      value: 6250,
      name: '网络与通信产业集群',
    },
    {
      value: 5500,
      name: '半导体与集成电路产业集群',
    },
    {
      value: 4362,
      name: '超高清视频显示产业集群',
    },
    {
      value: 4500,
      name: '智能终端产业集群',
    },
    {
      value: 1800,
      name: '软件与信息服务产业集群',
    },
    {
      value: 4100,
      name: '数字创意产业集群',
    },
    {
      value: 3800,
      name: '现代时尚产业集群',
    },
    {
      value: 2300,
      name: '工业母机产业集群',
    },
    {
      value: 2500,
      name: '智能机器人产业集群',
    },
    {
      value: 2900,
      name: '其他',
    },
  ];
  // @ts-ignore
  getAreaData.sort((a, b) => a.value - b.value);
  let dataName = getAreaData.map((v) => v.name);
  const areaOneData: Array<any> = [
    {
      name: '宝安区',
      data: getAreaData,
      color: '#56FDFF',
      borderColor: ['#06BDBF', '#56FDFF'],
      labelPosition: 'right',
      barWidth: 18,
      barBorderRadius: [0, 4, 4, 0],
      borderColorPosition: {
        x2: 1,
        y2: 0,
      },
    },
  ];
  const areaTwoData: Array<any> = [
    {
      name: '福田区',
      data: getAreaData,
      color: '#FFD18A',
      borderColor: ['#FFD18A', '#FFA213'],
      labelPosition: 'right',
      barWidth: 18,
      barBorderRadius: [0, 4, 4, 0],
      borderColorPosition: {
        x2: 1,
        y2: 0,
      },
    },
  ];
useEffect(() => {
  let option: EChartsCoreOption;
  option = {

    yAxis: {
      type: 'category',
      name: '',
      data: dataName,
      axisLabel: {
        padding: [0, 0, 10, -10],
        margin: 10,
        inside: true,
        textStyle: {
          fontSize: 12,
          fontFamily: 'PingFangSC-Semibold',
          fontWeight: 600,
          color: '#fff',
          align: 'left',
        },
        width: 350,
        overflow: 'truncate',
        formatter: '{value}\n{a|占位}',
        rich: {
          a: {
            color: 'transparent',
            lineHeight: 22,
            fontFamily: 'digital',
            fontSize: 20,
            shadowColor: 'rgba(0, 0, 0, 1)',
            shadowBlur: 10,
          },
        },
      },
      splitLine: {
        show: false,
      },
      axisTick: {
        show: false,
      },
      axisLine: {
        show: false,
      },
    },
  };
  setAreaOption(option);
}, []);

 浙公网安备 33010602011771号