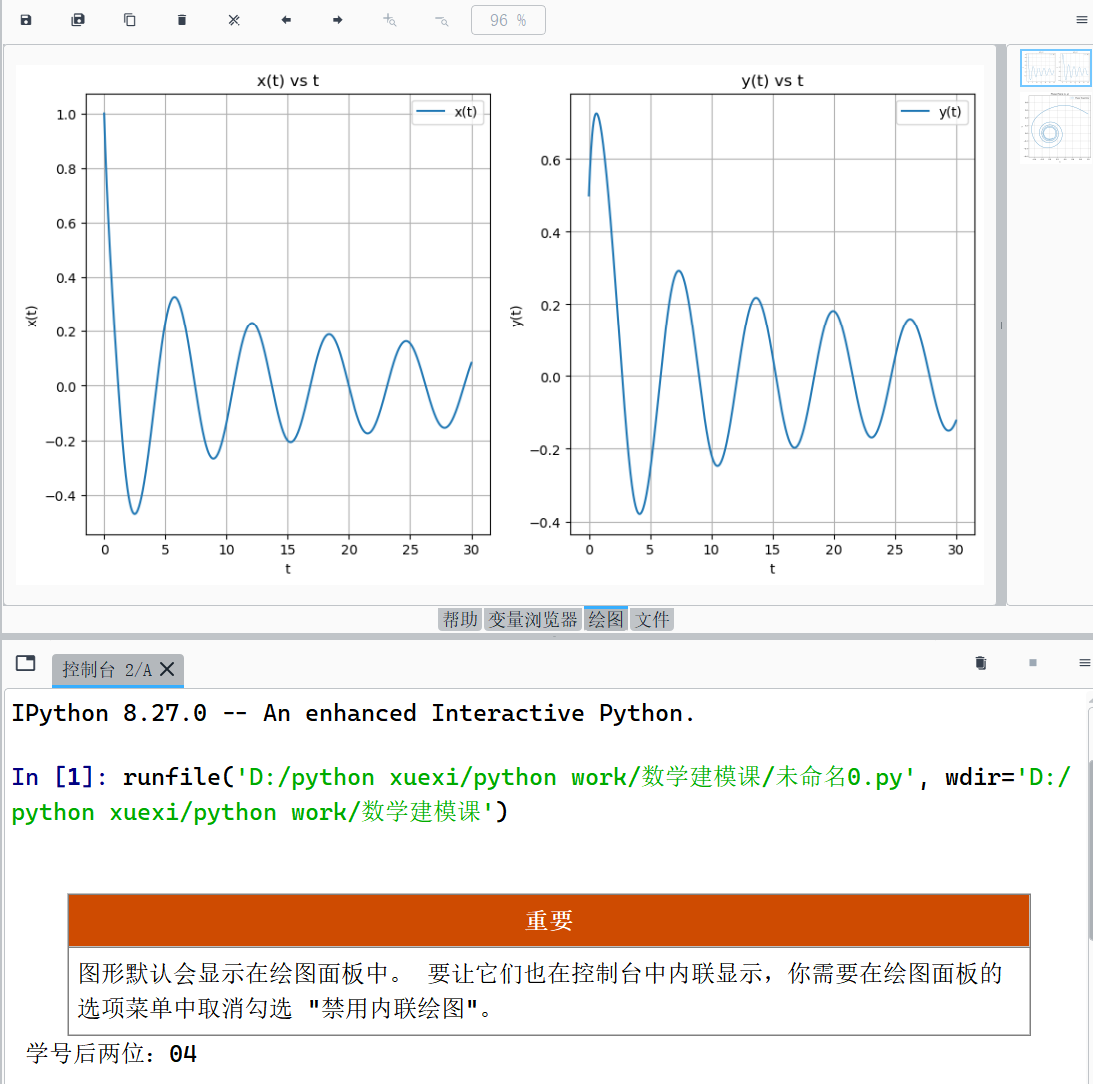
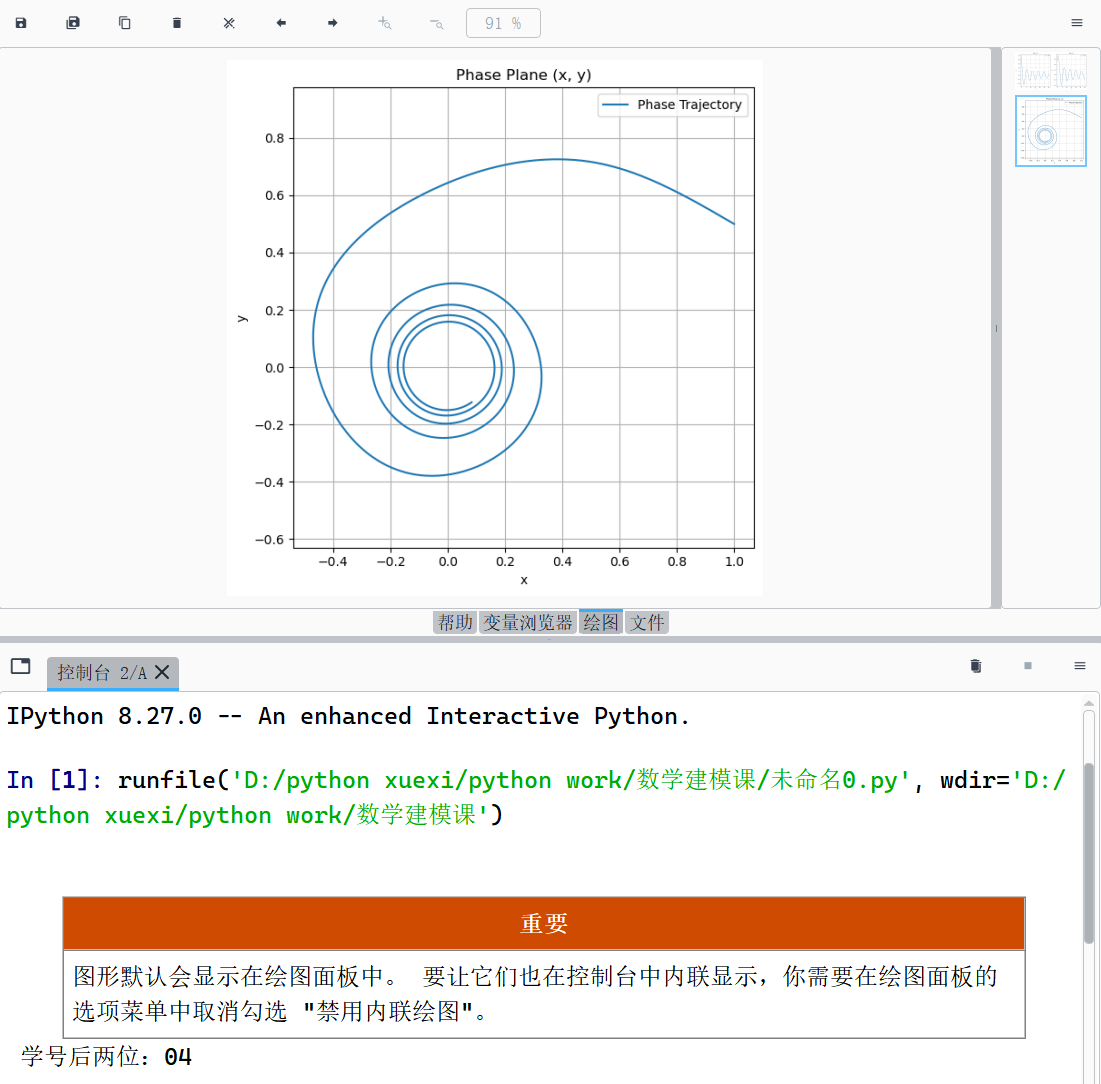
8.4 求微分方程组的数值解 x'=-x^3-y,x(0)=1,y'=x-y^3,y(0)=0.5,0<=t<=30,要求画出x(t)和y(t)的解曲线图形,再相平面上画出轨线
import numpy as np
import matplotlib.pyplot as plt
from scipy.integrate import solve_ivp
def system(t, state):
x, y = state
dxdt = -x3 - y
dydt = x - y3
return [dxdt, dydt]
t_span = (0, 30)
y0 = [1, 0.5]
sol = solve_ivp(system, t_span, y0, t_eval=np.linspace(t_span[0], t_span[1], 1000))
x = sol.y[0]
y = sol.y[1]
t = sol.t
plt.figure(figsize=(12, 6))
plt.subplot(1, 2, 1)
plt.plot(t, x, label='x(t)')
plt.xlabel('t')
plt.ylabel('x(t)')
plt.title('x(t) vs t')
plt.legend()
plt.grid(True)
plt.subplot(1, 2, 2)
plt.plot(t, y, label='y(t)')
plt.xlabel('t')
plt.ylabel('y(t)')
plt.title('y(t) vs t')
plt.legend()
plt.grid(True)
plt.figure(figsize=(6, 6))
plt.plot(x, y, label='Phase Trajectory')
plt.xlabel('x')
plt.ylabel('y')
plt.title('Phase Plane (x, y)')
plt.legend()
plt.grid(True)
plt.axis('equal')
plt.tight_layout()
plt.show()
print("学号后两位:04")

 浙公网安备 33010602011771号