利用 ECharts 地图:实现纹理和图像的效果(上海json)
注:shanghaiGeoJSON 换为你需要的区域json
<template>
  <div ref="mapContainer" style="width: 100%; height: 500px"></div>
</template>
import * as echarts from 'echarts';
import shanghaiGeoJSON from '@/assets/json/shanghai.json';
import mapRight from '@/assets/img/mapRight.png';
import mapTexture from '@/assets/img/OIP.jpg';
import pudongTexture from '@/assets/img/OIP1.jpg';
initMap() {
     // 注册地图数据
     echarts.registerMap('shanghai', shanghaiGeoJSON);

     // 初始化ECharts实例
     const myChart = echarts.init(this.$refs.mapContainer);

     // 配置ECharts选项
     myChart.setOption({
       series: [
         {
           name: '数据',
           type: 'map',
           // silent: true, // 图形不响应和触发鼠标事件
           mapType: 'shanghai',
           itemStyle: {
             normal: {
               borderColor: '#88a4bc', // 区域边框颜色
               areaColor: {
                 image: mapTexture, // 使用默认图片作为地图纹路
                 repeat: 'repeat', // 图片平铺
               },
             },
             emphasis: {
               z: -1,
               areaColor: 'rgba(12, 40, 80, 0.1)', // 区域鼠标悬浮颜色,半透明
             },
           },
           data: [
             {
               name: '浦东新区',
               itemStyle: {
                 normal: {
                   areaColor: {
                     image: pudongTexture, // 为浦东新区设置特定的纹理图片
                     repeat: 'repeat',
                   },
                 },
               },
             },
           ],
           label: {
             show: false,
             emphasis: {
               // 当鼠标悬浮时显示
               show: false,
               color: '#fff',
             },
           },
         },
       ],
       graphic: {
         type: 'image',
         right: '20%',
         bottom: '12%',
         z: -10,
         style: {
           image: mapRight,
           width: 132,
           height: 139,
         },
       },
     });
   },
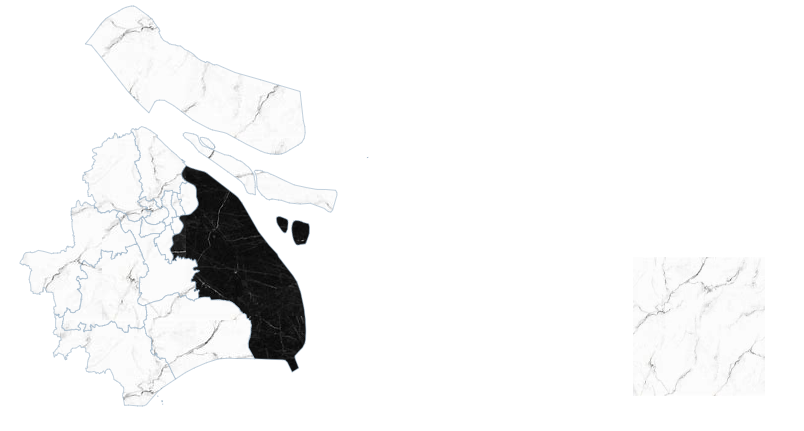
效果图:

 浙公网安备 33010602011771号