
kafka的错误日志log监控
例如:需要监控下面的日志中的error
日志文件是这个 /data1/confluent-5.2.2/logs/connect/kafka-connect.log
1/ 参考上一篇安装zabbix_agent:https://www.cnblogs.com/hongfeng2019/p/11338513.html
2/ 运行python脚本
mkdir -p /home/script
vim /home/script/check_log.py


#!/usr/bin/env python
# -*- coding: utf-8 -*-
import sys

import re


def prePos(seekfile):
    global curpos
    try:
        cf = open(seekfile)
    except IOError:
        curpos = 0
        return curpos
    except FileNotFoundError:
        curpos = 0
        return curpos
    else:
        try:
            curpos = int(cf.readline().strip())
        except ValueError:
            curpos = 0
            cf.close()
            return curpos
        cf.close()
    return curpos


def lastPos(filename):
    with open(filename) as lfile:
        if lfile.readline():
            lfile.seek(0, 2)
        else:
            return 0
        lastPos = lfile.tell()
    return lastPos


def getSeekFile():
    try:
        seekfile = sys.argv[2]
    except IndexError:
        seekfile = '/tmp/logseek'
    return seekfile


def getKey():
    try:
        tagKey = str(sys.argv[3])
    except IndexError:
        tagKey = 'Error'
    return tagKey


def getResult(filename, seekfile, tagkey):
    # 获取上一次检查文件时文件末尾的位置
    destPos = prePos(seekfile)
    # 获取当前文件末尾位置
    curPos = lastPos(filename)

    if curPos < destPos:
        curpos = 0

    try:
        f = open(filename)
    except IOError:
        print('Could not open file: %s' % filename)
    except FileNotFoundError:
        print('Could not open file: %s' % filename)
    else:
        # 指针偏移到上次检查文件是的末尾位置
        f.seek(destPos)
        global result
        result = 0
        while curPos != 0 and f.tell() < curPos:
            rresult = f.readline().strip()

            if re.search(tagkey, rresult,re.I):
                with open(sys.argv[4], 'a+') as wsf:
                #with open('/tmp/55.log', 'a+') as wsf:
                    wsf.write(rresult + "\n")
                result+=1

        with open(seekfile, 'w+') as sf:
            sf.write(str(curPos))
    finally:
        f.close()
    return result


if __name__ == "__main__":
    result = 0
    curpos = 0
    tagkey = getKey()
    seekfile = getSeekFile()
    result = getResult(sys.argv[1], seekfile, tagkey)
    #result = getResult('cookies.dat', '/tmp/1.log', 'error',)
    print(result)

    # UserParameter = check_log, /usr/bin/python/scripts/log.py/opt/a.log/opt/logseek Error
    # 第一个参数代表要监控的日志文件
    # 第二个参数代表每次查看完日志文件缓存看到哪里了的日志文件
    # 第三个参数代表监控的关键字
    # 第四个参数代表筛选出的日志存放位置
# 第一个参数代表要监控的日志文件
# 第二个参数代表每次查看完日志文件缓存看到哪里了的日志文件
# 第三个参数代表监控的关键字,如error 注: 有括号的要转义'\[ERROR\]'
# 第四个参数代表筛选出的error日志存放位置
mkdir /tmp/question_log
chmod -R 777 /tmp/question_log
/bin/python /home/script/check_log.py /data1/confluent-5.2.2/logs/connect/kafka-connect.log /tmp/question_log/check_kafka-connect_tag.log error /tmp/question_log/kafka-connect_question.log
运行两次测试: 最新的error数为0
3/ 建立一个user的键值脚本
vim /etc/zabbix/zabbix_agentd.d/userparameter_script.conf
UserParameter=check_kafka-connect_error_log,/bin/python /home/script/check_log.py /data1/confluent-5.2.2/logs/connect/kafka-connect.log /tmp/question_log/check_dispatcher_tag.log error /tmp/question_log/dispatcher_question.log
4/ 让zabbix用户有访问log文件的权限
chown zabbix.root /data1/confluent-5.2.2/logs/connect/kafka-connect.log
5/ 从服务器上看能否拿到error的数值
[root@backup ~]# zabbix_get -s 10.52.110.48 -k check_kafka-connect_error_log
0
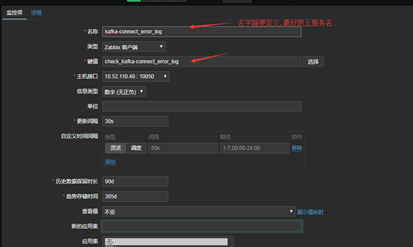
6/ 登陆zabbix的管理界面,建监控项
为监控的机器添加一个监控项,监控项的键值从上面的第三步的键值脚本中来
check_kafka-connect_error_log
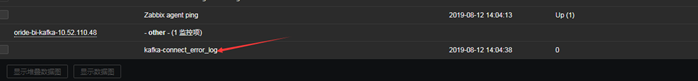
7/ 测试:点监测---最新数据找到新加的监控项看有没有值传过来.
找到你添加监控的机器

看出现监控项没有
7 有的话, 添加触发器
创建触发器--写上触发器的名称
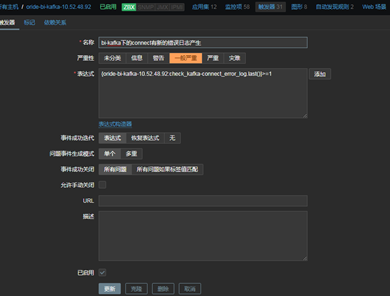
在表达式项点添加按钮--点选择--选择上面建的监控项--结果那项选>=1


 浙公网安备 33010602011771号