
实验2-鸢尾花实验
jupyter notebook下运行
打开jupyter
source activate myenv
jupyter notebook --ip 0.0.0.0 --allow-root
将代码文件放入虚拟机中,然后用jupyter打开运行即可
在pycharm运行
# 使用无监督聚类 k-means
import numpy as np
import matplotlib.pyplot as plt
from mpl_toolkits.mplot3d import Axes3D
from sklearn.cluster import KMeans
from sklearn import datasets
np.random.seed(5)
centers = [[1, 1], [-1, -1], [1, -1]]
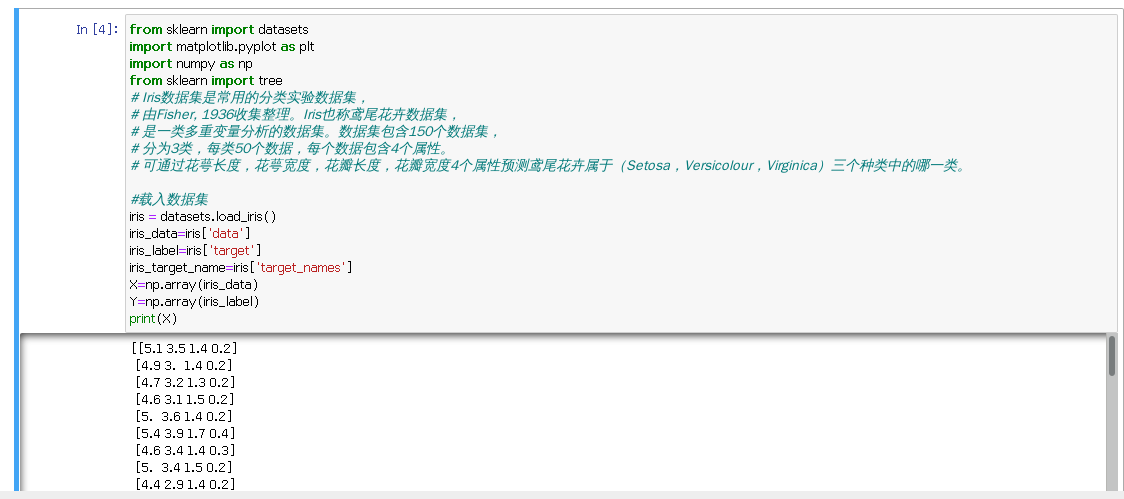
iris = datasets.load_iris()
X = iris.data
y = iris.target
estimators = {'k_means_iris_3': KMeans(n_clusters=3),
'k_means_iris_8': KMeans(n_clusters=8),
'k_means_iris_bad_init': KMeans(n_clusters=3, n_init=1,
init='random')}
fignum = 1
for name, est in estimators.items():
fig = plt.figure(fignum, figsize=(4, 3))
plt.clf()
ax = Axes3D(fig, rect=[0, 0, .95, 1], elev=48, azim=134)
fig.add_axes(ax)
plt.cla()
est.fit(X)
labels = est.labels_
ax.scatter(X[:, 3], X[:, 0], X[:, 2], c=labels.astype(float))
ax.xaxis.set_ticklabels([])
ax.yaxis.set_ticklabels([])
ax.zaxis.set_ticklabels([])
ax.set_xlabel('Petal width')
ax.set_ylabel('Sepal length')
ax.set_zlabel('Petal length')
fignum = fignum + 1
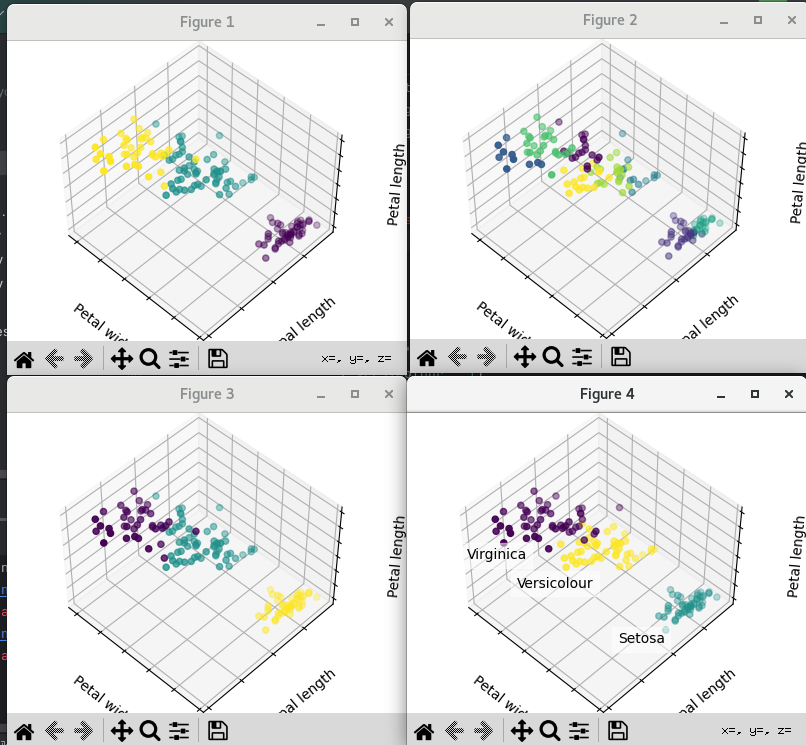
# Plot the ground truth
fig = plt.figure(fignum, figsize=(4, 3))
plt.clf()
ax = Axes3D(fig, rect=[0, 0, .95, 1], elev=48, azim=134)
fig.add_axes(ax)
plt.cla()
for name, label in [('Setosa', 0),
('Versicolour', 1),
('Virginica', 2)]:
ax.text3D(X[y == label, 3].mean(),
X[y == label, 0].mean() + 1.5,
X[y == label, 2].mean(), name,
horizontalalignment='center',
bbox=dict(alpha=.5, edgecolor='w', facecolor='w'))
# Reorder the labels to have colors matching the cluster results
y = np.choose(y, [1, 2, 0]).astype(float)
ax.scatter(X[:, 3], X[:, 0], X[:, 2], c=y)
ax.xaxis.set_ticklabels([])
ax.yaxis.set_ticklabels([])
ax.zaxis.set_ticklabels([])
ax.set_xlabel('Petal width')
ax.set_ylabel('Sepal length')
ax.set_zlabel('Petal length')
plt.show()
(上面的代码已经改好了)这里注意:
①
y = np.choose(y, [1, 2, 0]).astype(np.float)
改为
y = np.choose(y, [1, 2, 0]).astype(float)
②将所有的w_xaxis、w_yaxis、w_zaxis都改为xaxis、yaxis、zaxis
③在所有的ax = Axes3D(fig, rect=[0, 0, .95, 1], elev=48, azim=134)后面加一行fig.add_axes(ax)
运行结果:

 浙公网安备 33010602011771号