

监控nginx-2
https://www.cnblogs.com/zmh520/p/17758730.html
操作场景
prometheus 监控nginx有两种方式。一种是通过nginx_exporter监控,需要开启nginx_stub_status,主要是nginx自身的status信息,metrics数据现对较少;另外一种使用nginx-vts-exporter监控,但是需要在编译nginx的时候添加nginx-module-vts模块,监控数据较多,提供了包含server、upstream以及cache的相关监控指标,指标更丰富,所以采用nginx-vts-exporter实现对nginx的监控。
操作步骤(楼主都不是新安装的nginx)
第一种方式:nginx-vts-exporter
| 版本 | 地址 | |
|---|---|---|
| nginx | 1.17.6 | http://nginx.org/download/nginx-1.17.6.tar.gz |
| vts | 0.2.2 | https://github.com/vozlt/nginx-module-vts/releases |
| nginx-vts-exporter | 0.10.8 | https://github.com/hnlq715/nginx-vts-exporter/releases |
安装nginx-module-vts
#进入未编译的安装目录
cd /home/nginx-1.17.6
#下载解压nginx-module-vts
wget ; tar -zxvf
#预编译 需要新增--add-module=
--prefix=/home/S2B/nginx/nginx --add-module=/opt/nginx-module-vts-0.2.2
#编译(这里只make,不要make install ,不然会覆盖,如果新装的可以继续make install)
make&make install (我是有执行install)
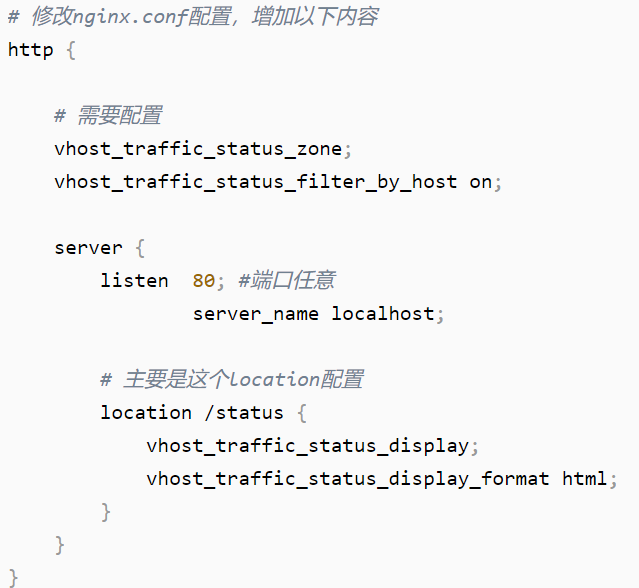
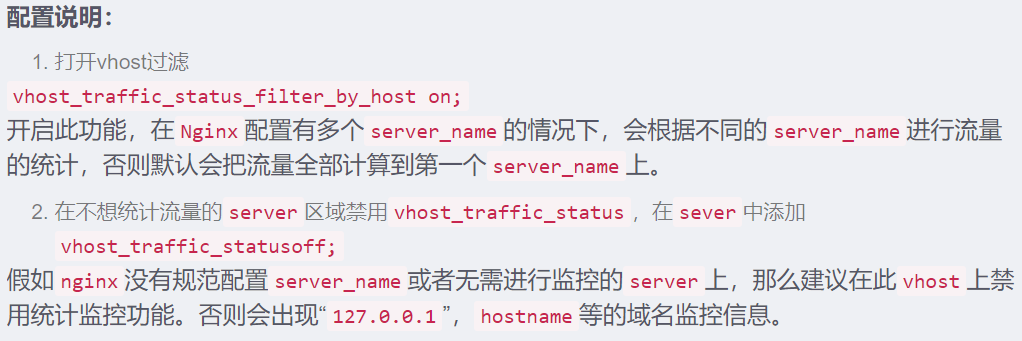
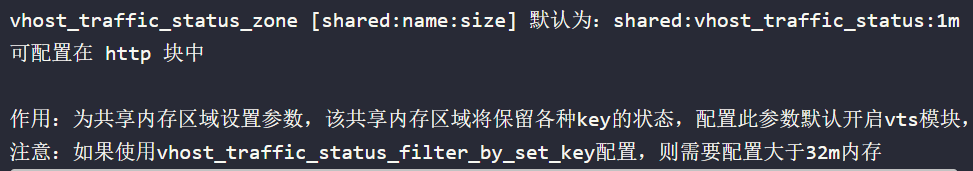
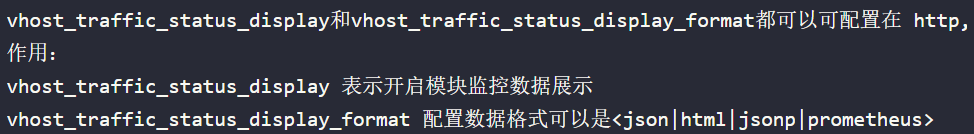
配置/status
停止后启动nginx
./nginx -s stop
./nginx
验证
浏览器访问:http://ip:port/status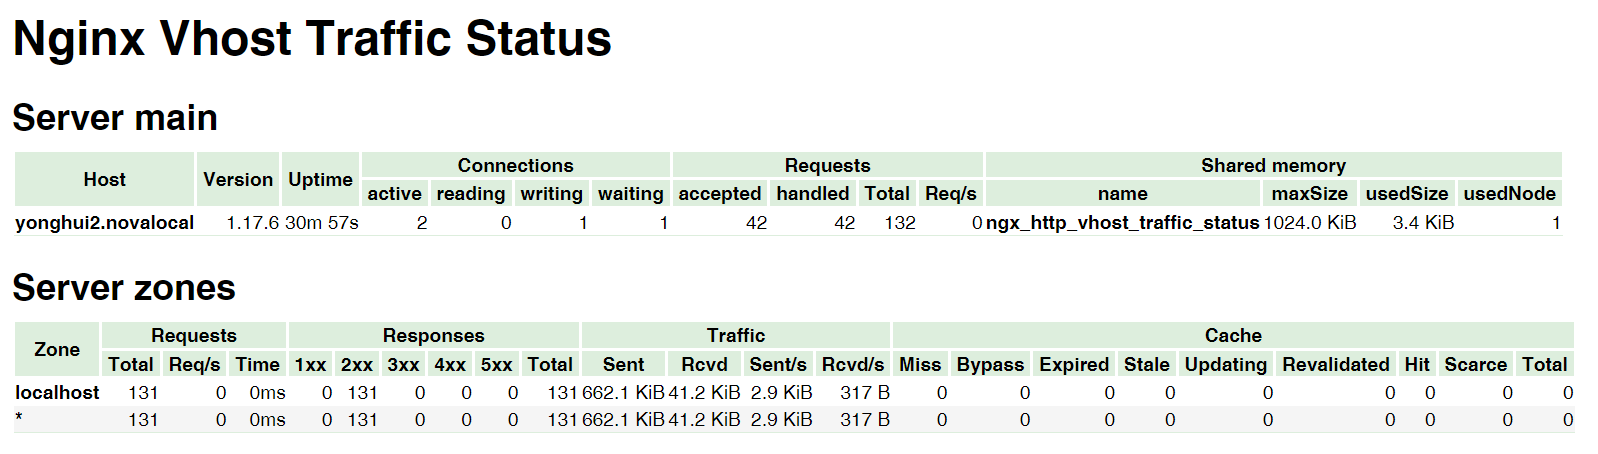
监控字段总结
Server main 主服务器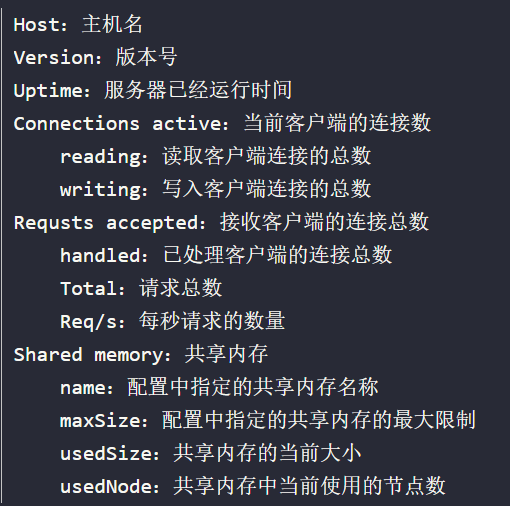
Server zones服务器区域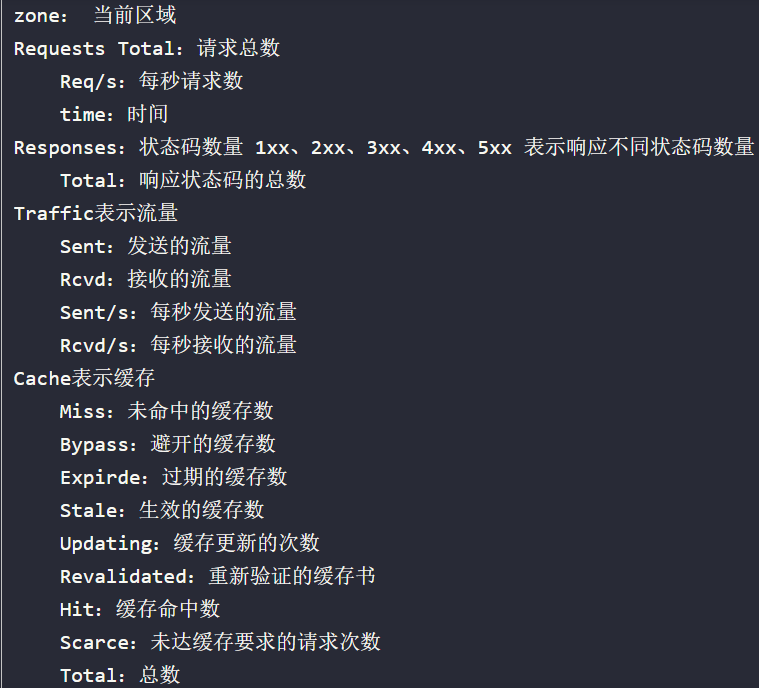
安装启动nginx-vts-exporter
下载连接:https://github.com/hnlq715/nginx-vts-exporter/releases
解压tar -zxvf
赋权 chmod +x /usr/local/nginx_exporter/bin/nginx_vts_exporter -R
设置systemctl启动
vim /usr/lib/systemd/system/nginx-exporter.service

[Unit]
Description=nginx_vts_exporter
After=network.target

[Service]
Type=simple
ExecStart=/usr/local/nginx_exporter/bin/nginx_vts_exporter -nginx.scrape_uri http://192.168.1.1/status/format/json
Restart=on-failure

[Install]
WantedBy=multi-user.target
启动nginx_exporter
systemctl enable nginx_exporter
systemctl status nginx_exporter
systemctl start nginx_exporter
修改prometheus配置文件并重启
- job_name: 'nginx'
  static_configs:
  - targets: ['192.168.1.1:9913']
    labels:
      instance: nginx
grafana导入nginx-vts-exporter监控
模板连接:https://grafana.com/grafana/dashboards/2949
第二种方式:nginx_stub_status
1.下载 https://github.com/nginxinc/nginx-prometheus-exporter/releases
2.解压 tar -zxvf
3.开启 NGINX stub_status 功能
安装此模块时发生的报错:
报错1:
checking for OS
 + Linux 2.6.32-431.el6.x86_64 x86_64
 checking for C compiler ... not found
 ./configure: error: C compiler cc is not found
解决
执行下面命令解决问题
yum -y install gcc gcc-c++ autoconf automake make
报错2:
./configure: error: the HTTP rewrite module requires the PCRE library. You can either disable the module by using --without-http_rewrite_module option, or install the PCRE library into the system, or build the PCRE library statically from the source with
解决
执行下面命令解决问题
在ubuntu上使用以下命令:sudo apt-get install libpcre3 libpcre3-dev
在centos7上使用以下命令:sudo yum install -y pcre pcre-devel
                       sudo yum install -y zlib-devel
-
开源 Nginx 提供一个简单页面用于展示状态数据,该页面由 stub_status 模块提供。执行以下命令检查 Nginx 是否已经开启了该模块:
nginx -V 2>&1 | grep -o with-http_stub_status_module
如果在终端中输出 with-http_stub_status_module ,则说明 Nginx 已启用 tub_status 模块。如果未输出任何结果,则可以使用 --with-http_stub_status_module 参数从源码重新配置编译一个 Nginx。示例如下:
./configure --prefix=/usr/local/nginx --with-http_stub_status_module
make & make install
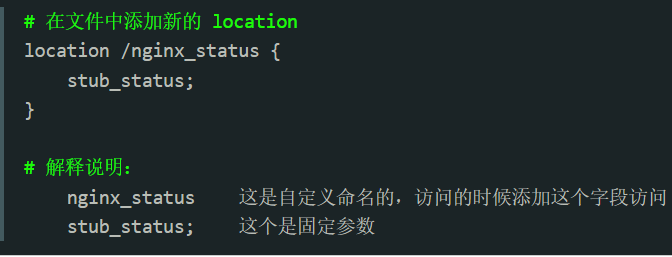
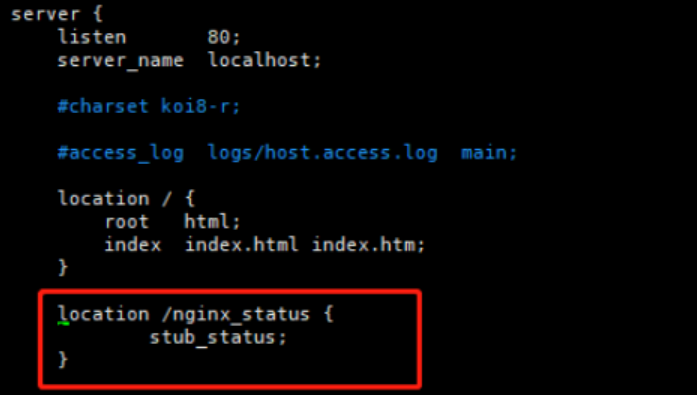
5.确认 stub_status 模块启用之后,修改 Nginx 的配置文件指定 status 页面的 URL。示例如下:
6.检查并重新加载 Nginx的配置使其生效
nginx -t
nginx -s reload
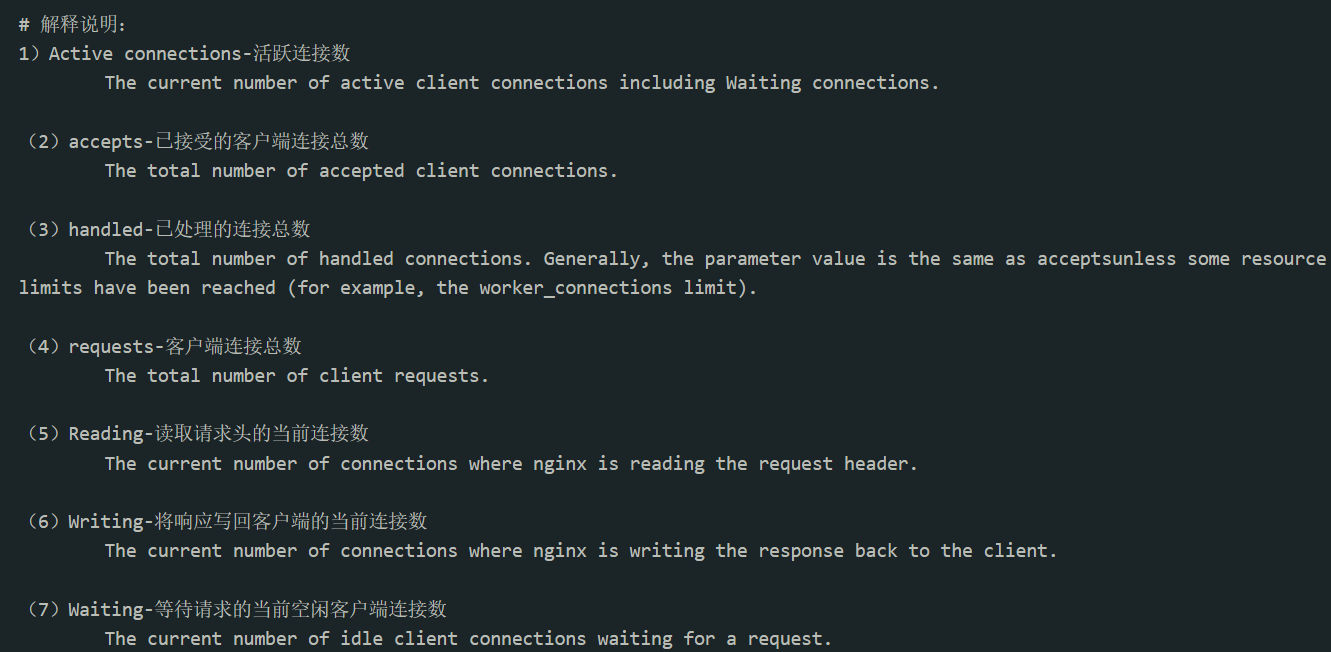
7.完成上述步骤之后,可以通过配置的 URL 查看 Nginx 的指标:
curl http://192.168.10.10:8080/stub_status

Active connections: 45
server accepts handled requests
1056958 1156958 4491319
Reading: 0 Writing: 25 Waiting : 7
运行 NGINX Prometheus Exporter
执行以下命令启动 NGINX Prometheus Exporter:
$ ./nginx-prometheus-exporter -nginx.scrape-uri=http://192.168.10.10:8080/nginx_status
备选docker启动:
$ docker run -p 9113:9113 nginx/nginx-prometheus-exporter:0.8.0 -nginx.scrape-uri=http://<nginx>:8080/stub_status

说明:
http://<nginx>:8080/stub_status 需要把<nginx>替换成实际服务的 IP 地址,如 http://192.168.10.10:8080/stub_status
上报指标
nginxexporter_build_info -- exporter 编译信息。
所有的 stub_status 指标。
nginx_up -- 展示上次抓取的状态:1表示抓取成功, 0表示抓取失败。
配置 Prometheus 的抓取 Job
-
Nginx Prometheus Exporter 正常运行后,执行以下命令,将 Job 添加到 Prometheus 的抓取任务中。
...
- job_name: 'nginx_exporter'
static_configs:- targets: ['192.168.10.10:8080']
- job_name: 'nginx_exporter'
-
通常情况下 ,Exporter 和 Nginx 并非共同运行,所以数据上报的 instance 并不能真实描述是哪个实例,为了方便数据的检索和观察,我们可以修改 instance 标签,使用真实的 IP 进行替换以便更加直观。示例如下:
...
- job_name: 'nginx_exporter'
static_configs:- targets: ['192.168.10.10:8080']
relabel_configs: - source_labels: [address]
regex: '.*'
target_label: instance
replacement: '10.0.0.1:80'
- targets: ['192.168.10.10:8080']
查看监控
Prometheus 监控服务在 Grafana 中提供预先配置的 Nginx Exporter Dashboard,您可以根据以下操作步骤查看 Nginx 监控数据。
- 登录 Prometheus 监控服务控制台。
- 单击对应实例 ID 右侧的

 浙公网安备 33010602011771号