
angular和echarts的结合使用,折线图指令
点击运行可以直接查看效果
具体的效果图
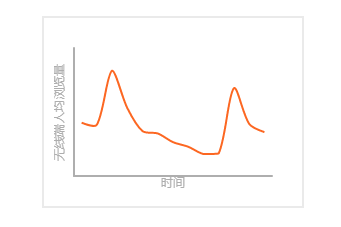
具体的使用方法:
引入echarts.js文件 指令传入参数;
注意由于指令的数据是从后台取到的
如果的单纯的写指令值是不能够传入的,所以这里使用了
$scope.$watchGroup函数
html:
<line legend="legend" data="item.tag_values" xaxis="item.tag_third"></line>
js
 app.register.directive('line', function() {
return {
scope: {
legend: "=",
data: "=",
xaxis:'='
},
restrict: 'E',
template: '<div class="canvas"></div>',
replace: true,
link: function($scope, element, attrs, controller) {
$scope.$watchGroup(['data','xaxis'], function (n_value) {
if (n_value) {
var option = {
// 横轴坐标轴
xAxis: [{
type: 'category',
name: '时间',
nameLocation:'middle',
nameGap:0,
data: ["","","","","","","","","","","","",""],
splitLine: {
show: false,
// 改变轴线颜色
lineStyle: {
// 使用深浅的间隔色
color: ['blue']
}
},
// 改变x轴颜色
axisLine:{
lineStyle:{
color:'#aeaeae',
width:2,
}
},
axisTick:{
show:false
}
// 改变x轴字体颜色和大小
/* axisLabel: {
textStyle: {
color: 'red',
fontSize:'20'
},
},*/
}],
// 纵轴坐标轴
yAxis: [{
type: 'value',
name: $scope.xaxis,
nameLocation:'middle',
nameGap:10,
nameRotate:90,
axisLine:{
lineStyle:{
color:'#aeaeae',
width:2,
}
},
splitLine: {
show: false,
// 改变轴线颜色
},
axisTick:{
show:false
},
axisLabel : {
formatter: function(){
return "";
}
}
}],
grid:{
left:20,
top:20,
right:20,
bottom:20
},
series:[{
type: 'line',
smooth: true,
data: $scope.data.split(','),
showSymbol:false,
itemStyle: {
normal: {
lineStyle: {
// 区域图,纵向渐变填充
color: '#fc6722',
}
}}
}]
// 数据内容数组
};
var myChart = echarts.init(element[0],'macarons');
myChart.setOption(option);
}
})
}
};
});

 浙公网安备 33010602011771号