


ELK7.8.0版本整合记录
1.搭建elasticsearch 版本:7.8.0
1.前期准备:
2. elasticsearch,logstash,kibana的7.8.0下载
2.配置修改
在config下的elasticsearch.yml
#配置节点名称,为下面的cluster.initial_master_nodes铺垫
node.name: node-1
#配置日志路径
path.logs: /usr/local/app/elasticsearch-7.8.0/logs
#配置外网访问(需关闭防火墙)
network.host: 0.0.0.0
#配置端口号
http.port: 9200
3. 启动elasticsearch
在bin目录下,切换到非root用户,启动命令: ./elasticsearch
后台启动elasticsearch,需要使用: ./elasticsearch -d
这时执行的时候会出现没有权限./elasticsearch: Permission denied
需要授权执行命令:chmod +x bin/elasticsearch
再次执行./elasticsearch -d即可启动
使用ps aux|grep elasticsearch可以查看是否启动
4.可能出现的bug以及解决方案
报错: max file descriptors [4096] for elasticsearch process is too low, increase to at least [65535]
解决方案: 编辑 /etc/security/limits.conf,追加以下内容;
* soft nofile 65536
* hard nofile 65536
此文件修改后需要重新重新启动或者登录用户,才会生效
报错:max virtual memory areas vm.max_map_count [65530] is too low, increase to at least [262144]
解决方案:
切换到root用户,执行命令:
sysctl -w vm.max_map_count=262144
查看结果:
sysctl -a|grep vm.max_map_count
显示:
vm.max_map_count = 262144
上述方法修改之后,如果重启虚拟机将失效,所以:
解决办法:
在 /etc/sysctl.conf文件最后添加一行
vm.max_map_count=262144
即可永久修改
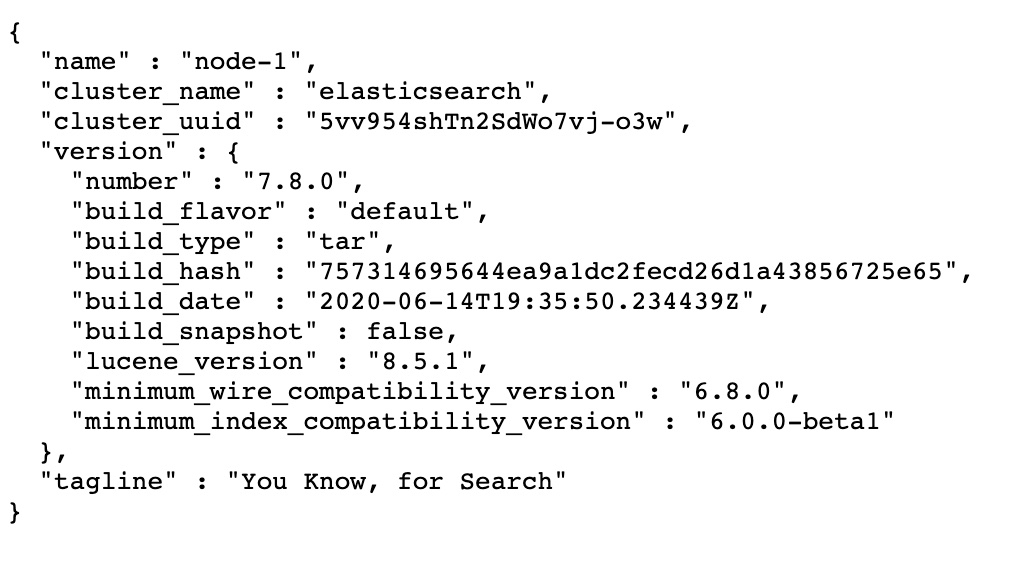
5.浏览器页面浏览
比如我自己的虚拟机器ip是192.168.1.10 ,那么浏览器访问http://192.168.1.10:9200/
2.搭建logstash 版本:7.8.0
1.新增配置
初始化配置文件为config目录下的logstash-sample.conf
1.读取文件直接发送到es
         input {
                #beats {
                # port => 5044
                #}
                file {
                    path => "/var/log/httpd/access_log"
                    start_position => beginning
                     }
                }

         output {
                elasticsearch {
                    hosts => ["http://localhost:9200"]
                    index => "%{[@metadata][logstash]}-%{[@metadata][version]}-%{+YYYY.MM.dd}"
                    #user => "elastic"
                    #password => "changeme"
                              }
                 }
2.tcp方式
         input {
                tcp {
                    ##host:port就是上面appender中的 destination,这里其实把logstash作为服务,开启8080端口接收logback发出的消息
                    host => "localhost"
                    port => 8080
                    #模式选择为server
                    mode => "server"
                    tags => ["tags"]

                    ##格式json
                    codec => json_lines
                    }

               }

         output {
                elasticsearch {
                    #ES地址
                    hosts => "127.0.0.1:9200"
                    #指定索引名字
                    index => "applog"
                    }
                stdout { codec => rubydebug}
                }
2.启动
定位到config目录下,启动命令: ../bin/logstash -f logstash-sample.conf
后台启动命令: ../bin/logstash -f logstash-sample.conf &
3.搭建kibana 版本:7.8.0
1.配置
1. 将kibana/config/kibana.yml中的默认配置#i18n.locale: "en"改为i18n.locale: "zh-CN"
2.在kibana/config/kibana.yml中修改配置
            server.port: 5601       ##服务端口
            server.host: "0.0.0.0"  ##服务器ip  本机
            elasticsearch.url: "http://localhost:9200" ##elasticsearch服务地址 与elasticsearch对应
2.启动
定位到bin目录下,启动命令: ./kibana &

 浙公网安备 33010602011771号