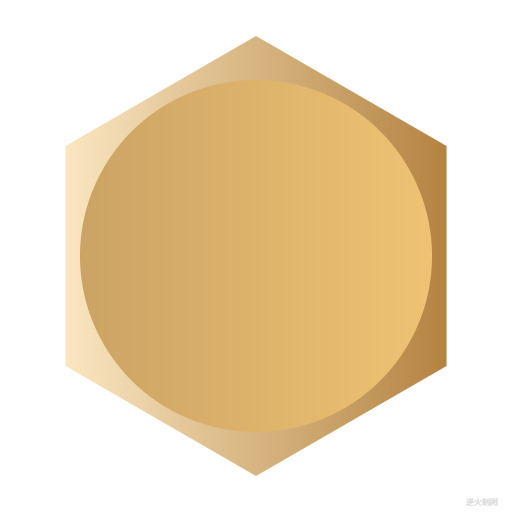
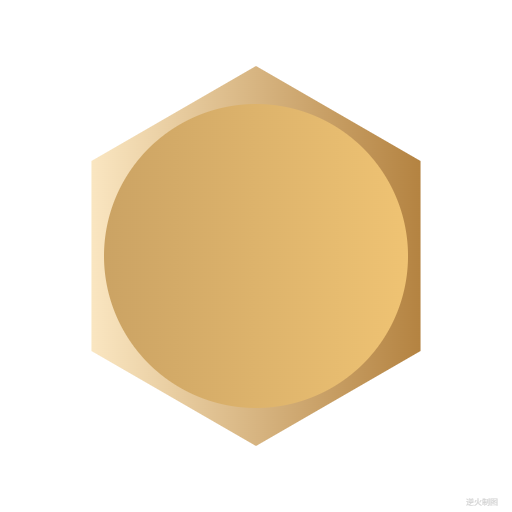
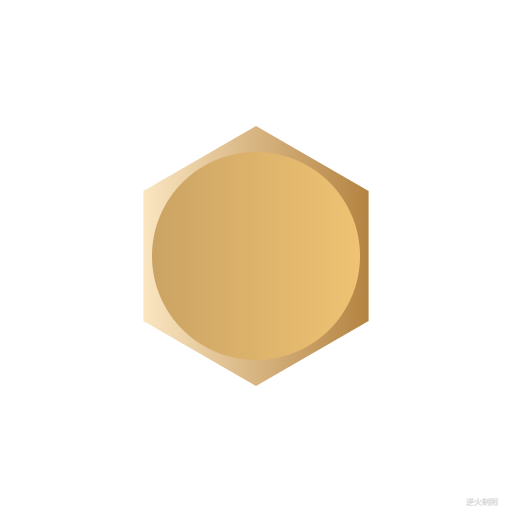
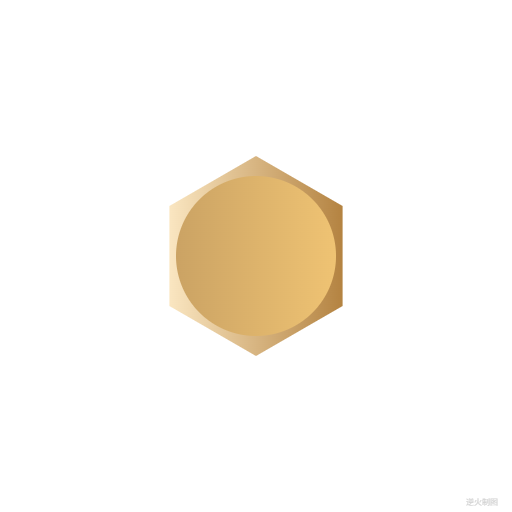
【Canvas与机械】铜制螺帽
【成图】


【代码】
<!DOCTYPE html>
<html lang="utf-8">
<meta http-equiv="Content-Type" content="text/html; charset=utf-8"/>
<head>
     <title>铜制螺帽 Draft1</title>
     <style type="text/css">
     .centerlize{
        margin:0 auto;
        width:1200px;
     }
     </style>
     </head>

     <body onload="init();">
        <div class="centerlize">
            <canvas id="myCanvas" width="12px" height="12px" style="border:1px dotted black;">
                如果看到这段文字说您的浏览器尚不支持HTML5 Canvas,请更换浏览器再试.
            </canvas>
        </div>
     </body>
</html>
<script type="text/javascript">
<!--
/*****************************************************************
* 将全体代码(从<!DOCTYPE到script>)拷贝下来,粘贴到文本编辑器中,
* 另存为.html文件,再用chrome浏览器打开,就能看到实现效果。
******************************************************************/

// canvas的绘图环境
var ctx;

// 高宽
const WIDTH=512;
const HEIGHT=512;

// 舞台对象
var stage;

//-------------------------------
// 初始化
//-------------------------------
function init(){
    // 获得canvas对象
    var canvas=document.getElementById('myCanvas');
    canvas.width=WIDTH;
    canvas.height=HEIGHT;

    // 初始化canvas的绘图环境
    ctx=canvas.getContext('2d');
    ctx.translate(WIDTH/2,HEIGHT/2);// 原点平移

    // 准备
    stage=new Stage();
    stage.init();

    // 开幕
    animate();
}

// 播放动画
function animate(){
    stage.update();
    stage.paintBg(ctx);
    stage.paintFg(ctx);

    // 循环
    if(true){
        //sleep(100);
        window.requestAnimationFrame(animate);
    }
}

// 舞台类
function Stage(){
    // 初始化
    this.init=function(){

    }

    // 更新
    this.update=function(){

    }

    // 画背景
    this.paintBg=function(ctx){
        ctx.clearRect(-WIDTH/2,-HEIGHT/2,WIDTH,HEIGHT);// 清屏
    }

    // 画前景
    this.paintFg=function(ctx){
        // 底色
        ctx.save();
        //ctx.fillStyle = "rgb(1,84,152)";
        //ctx.fillRect(-WIDTH/2,-HEIGHT/2,WIDTH,HEIGHT);
        ctx.restore();

        const R=220;//基准尺寸
        var ct=createPt(0,0);// ct=center

        // #1 外六角
        ctx.save();
        var r=R*1.00;
        var left=createPt3(ct,r*Math.cos(Math.PI/6),Math.PI);
        var right=createPt3(ct,r*Math.cos(Math.PI/6),0);
        var gnt=ctx.createLinearGradient(left.x,left.y,right.x,right.y);
        gnt.addColorStop(0,"rgb(250,230,193)");
        gnt.addColorStop(1,"rgb(180,131,65)");
        ctx.fillStyle=gnt;
        drawPolygon(ctx,6,ct.x,ct.y,r,Math.PI/6);
        ctx.fill();
        ctx.restore();

        // #2 内圆
        ctx.save();
        var r=R*0.80;
        var left=createPt3(ct,r,Math.PI);
        var right=createPt3(ct,r,0);
        var gnt=ctx.createLinearGradient(left.x,left.y,right.x,right.y);
        gnt.addColorStop(0,"rgb(203,163,100)");
        gnt.addColorStop(1,"rgb(239,195,115)");
        drawSolidCircle(ctx,ct.x,ct.y,r,gnt);
        ctx.restore();

        writeText(ctx,WIDTH/2-30,HEIGHT/2-5,"逆火制图","8px consolas","lightgrey");// 版权
    }
}

/*----------------------------------------------------------
函数:绘制正多边形
n:正多边形的边数
x:正多边形中心的横坐标
y:正多边形中心的纵坐标
r:正多边形中心到顶点的距离
initAngle:初始角度
----------------------------------------------------------*/
function drawPolygon(ctx,n,x,y,r,initAngle){
    var polyArr=[];
    for(var i=0;i<n;i++){
        var theta=Math.PI*2/n*i+initAngle;
        var pt={};
        pt.x=r*Math.cos(theta)+x;
        pt.y=r*Math.sin(theta)+y;
        polyArr.push(pt);
    }

    ctx.beginPath();
    for(let i=0;i<polyArr.length;i++){
        ctx.lineTo(polyArr[i].x,polyArr[i].y);
    }
    ctx.closePath();
}

/*------------------------------------------------------------------------
 函数:drawEllipse函数的套娃函数
 ctx:绘图上下文
 x:椭圆中心点横坐标
 y:椭圆中心点纵坐标
 width:椭圆宽
 height:椭圆高
------------------------------------------------------------------------*/
function drawTuoYuan(ctx,x,y,width,height){
    drawEllipse(ctx,x-width/2,y-height/2,width,height);
}

/*------------------------------------------------------------------------
 函数:使用贝塞尔三次曲线拟近椭圆,
        该方法比原生的ellipse函数消耗小很多。
 ctx:绘图上下文
 x:椭圆左极点横坐标(注意不是中心点)
 y:椭圆左极点纵坐标(注意不是中心点)
 width:椭圆宽
 height:椭圆高
 注:该方法摘录自 张磊著《HTML5实验室-Canvas世界》,电子工业出版社出版
------------------------------------------------------------------------*/
function drawEllipse(ctx,x,y,width,height){
    var k=0.55228475;
    var ox=(width/2)*k;
    var oy=(height/2)*k;
    var xe=x+width;
    var ye=y+height;
    var xm=x+width/2;
    var ym=y+height/2;

    ctx.beginPath();
    ctx.moveTo(x,ym);
    ctx.bezierCurveTo(x,ym-oy,xm-ox,y,xm,y);
    ctx.bezierCurveTo(xm+ox,y,xe,ym-oy,xe,ym);
    ctx.bezierCurveTo(xe,ym+oy,xm+ox,ye,xm,ye);
    ctx.bezierCurveTo(xm-ox,ye,x,ym+oy,x,ym);
    ctx.closePath();
}

/*--------------------------------------------------
基础函数:绘制标准正五角星轮廓,可描边,可填充
ctx:绘图上下文
x:五角星中心横坐标
y:五角星中心纵坐标
R:五角星中心到顶点的距离
initAngle:初始角度
---------------------------------------------------*/
function draw5Star(ctx,x,y,R,initAngle){
    var r=R*Math.sin(Math.PI/10)/Math.sin(Math.PI/10*7);

    var arr=[0,0,0,0,0,0,0,0,0,0];

    // 顶五点
    for(var i=0;i<5;i++){
        var theta=i*Math.PI/5*2-Math.PI/10+initAngle;
        var x1=R*Math.cos(theta)+x;
        var y1=R*Math.sin(theta)+y;
        arr[i*2]=createPt(x1,y1);
    }

    // 内五点
    for(var i=0;i<5;i++){
        var theta=i*Math.PI/5*2+Math.PI/10+initAngle;
        var x1=r*Math.cos(theta)+x;
        var y1=r*Math.sin(theta)+y;
        arr[i*2+1]=createPt(x1,y1);
    }

    ctx.beginPath();
    for(var i=0;i<arr.length;i++){
        ctx.lineTo(arr[i].x,arr[i].y);
    }
    ctx.closePath();
}

/*----------------------------------------------------------
基础函数:用于从角度取得弧度,便于微调
degree:角度值,如30,60,90
返回值:弧度值,如PI/6,PI/3,PI/2
----------------------------------------------------------*/
function getRadian(degree){
    return degree/180*Math.PI;
}

/*----------------------------------------------------------
基础函数:用于取得两点间距离
p1:起点
p1:终点
----------------------------------------------------------*/
function getDistance(p1,p2){
    return Math.sqrt((p1.x-p2.x)*(p1.x-p2.x)+(p1.y-p2.y)*(p1.y-p2.y));
}

/*----------------------------------------------------------
基础函数:用于绘制矩形
ctx:绘图上下文
x:矩形中心横坐标
y:矩形中心纵坐标
width:矩形宽
height:矩形高
----------------------------------------------------------*/
function drawRect(ctx,x,y,width,height){
    ctx.beginPath();
    ctx.moveTo(x-width/2,y-height/2);
    ctx.lineTo(x+width/2,y-height/2);
    ctx.lineTo(x+width/2,y+height/2);
    ctx.lineTo(x-width/2,y+height/2);
    ctx.closePath();
}

/*----------------------------------------------------------
基础函数:用于绘制实心圆
ctx:绘图上下文
x:矩形中心横坐标
y:矩形中心纵坐标
r:圆半径
style:填充圆的方案
----------------------------------------------------------*/
function drawSolidCircle(ctx,x,y,r,style){
    ctx.fillStyle=style;
    ctx.beginPath();
    ctx.arc(x,y,r,0,Math.PI*2,false);
    ctx.closePath();
    ctx.fill();
}

/*----------------------------------------------------------
基础函数:创建一个二维坐标点
base:基准点,入参必需有x和y两参数
radius:当前点到基准点的距离
theta:当前点到基准点的角度
Pt即Point
----------------------------------------------------------*/
function createPt3(base,radius,theta){
    var retval={};
    retval.x=base.x+radius*Math.cos(theta);
    retval.y=base.y+radius*Math.sin(theta);
    return retval;
}

/*----------------------------------------------------------
基础函数:创建一个二维坐标点
baseX:基准点横坐标
baseY:基准点纵坐标
radius:当前点到基准点的距离
theta:当前点到基准点的角度
Pt即Point
----------------------------------------------------------*/
function createPt2(baseX,baseY,radius,theta){
    var retval={};
    retval.x=baseX+radius*Math.cos(theta);
    retval.y=baseY+radius*Math.sin(theta);
    return retval;
}

/*----------------------------------------------------------
基础函数:创建一个二维坐标点
x:横坐标
y:纵坐标
Pt即Point
----------------------------------------------------------*/
function createPt(x,y){
    var retval={};
    retval.x=x;
    retval.y=y;
    return retval;
}

/*----------------------------------------------------------
基础函数:延时若干毫秒
milliseconds:毫秒数
----------------------------------------------------------*/
function sleep(milliSeconds) {
    const date = Date.now();
    let currDate = null;
    while (currDate - date < milliSeconds) {
        currDate = Date.now();
    }
}

/*----------------------------------------------------------
基础函数:书写文字
ctx:绘图上下文
x:横坐标
y:纵坐标
text:文字
font:字体
color:颜色
----------------------------------------------------------*/
function writeText(ctx,x,y,text,font,color){
    ctx.save();
    ctx.textBaseline="bottom";
    ctx.textAlign="center";
    ctx.font = font;
    ctx.fillStyle=color;
    ctx.fillText(text,x,y);
    ctx.restore();
}

/*-------------------------------------------------------------
比如这个帖子https://www.zhihu.com/question/27621722(利用爬虫技术能做到哪些很酷很有趣很有用的事情?)

有些人去分析交易者情绪和行情的关系,得出行情好的时候交易者情绪高,这不都明摆着的吗?经历过一轮牛熊市的人都清楚。

还有些人幻想分析股吧去判断个股走向,简直是笑话,分析见涨一拥而上看跌一哄而散的散户有意义吗?又是一个瞎子点灯白费蜡的主。

不懂业务拿了数据也是瞎分析。

比如今天A队B队打一场,拿出过去20年的比赛数据说75%A胜,25%B胜,这样的统计有什么意义呢?人也不是当年那些人,地点时间全不一样了。

其实一般人只是推演的水平,涨了看涨,跌了看跌,振荡的时候八面风两头堵;很多大数据也只是这个水平,只是借IT技术穿了不少马甲而已。
--------------------------------------------------------------*/
//-->
</script>
END

 浙公网安备 33010602011771号